29
/
en
AIzaSyAYiBZKx7MnpbEhh9jyipgxe19OcubqV5w
April 1, 2024
276069
United Kingdom
GBR
true
2
1
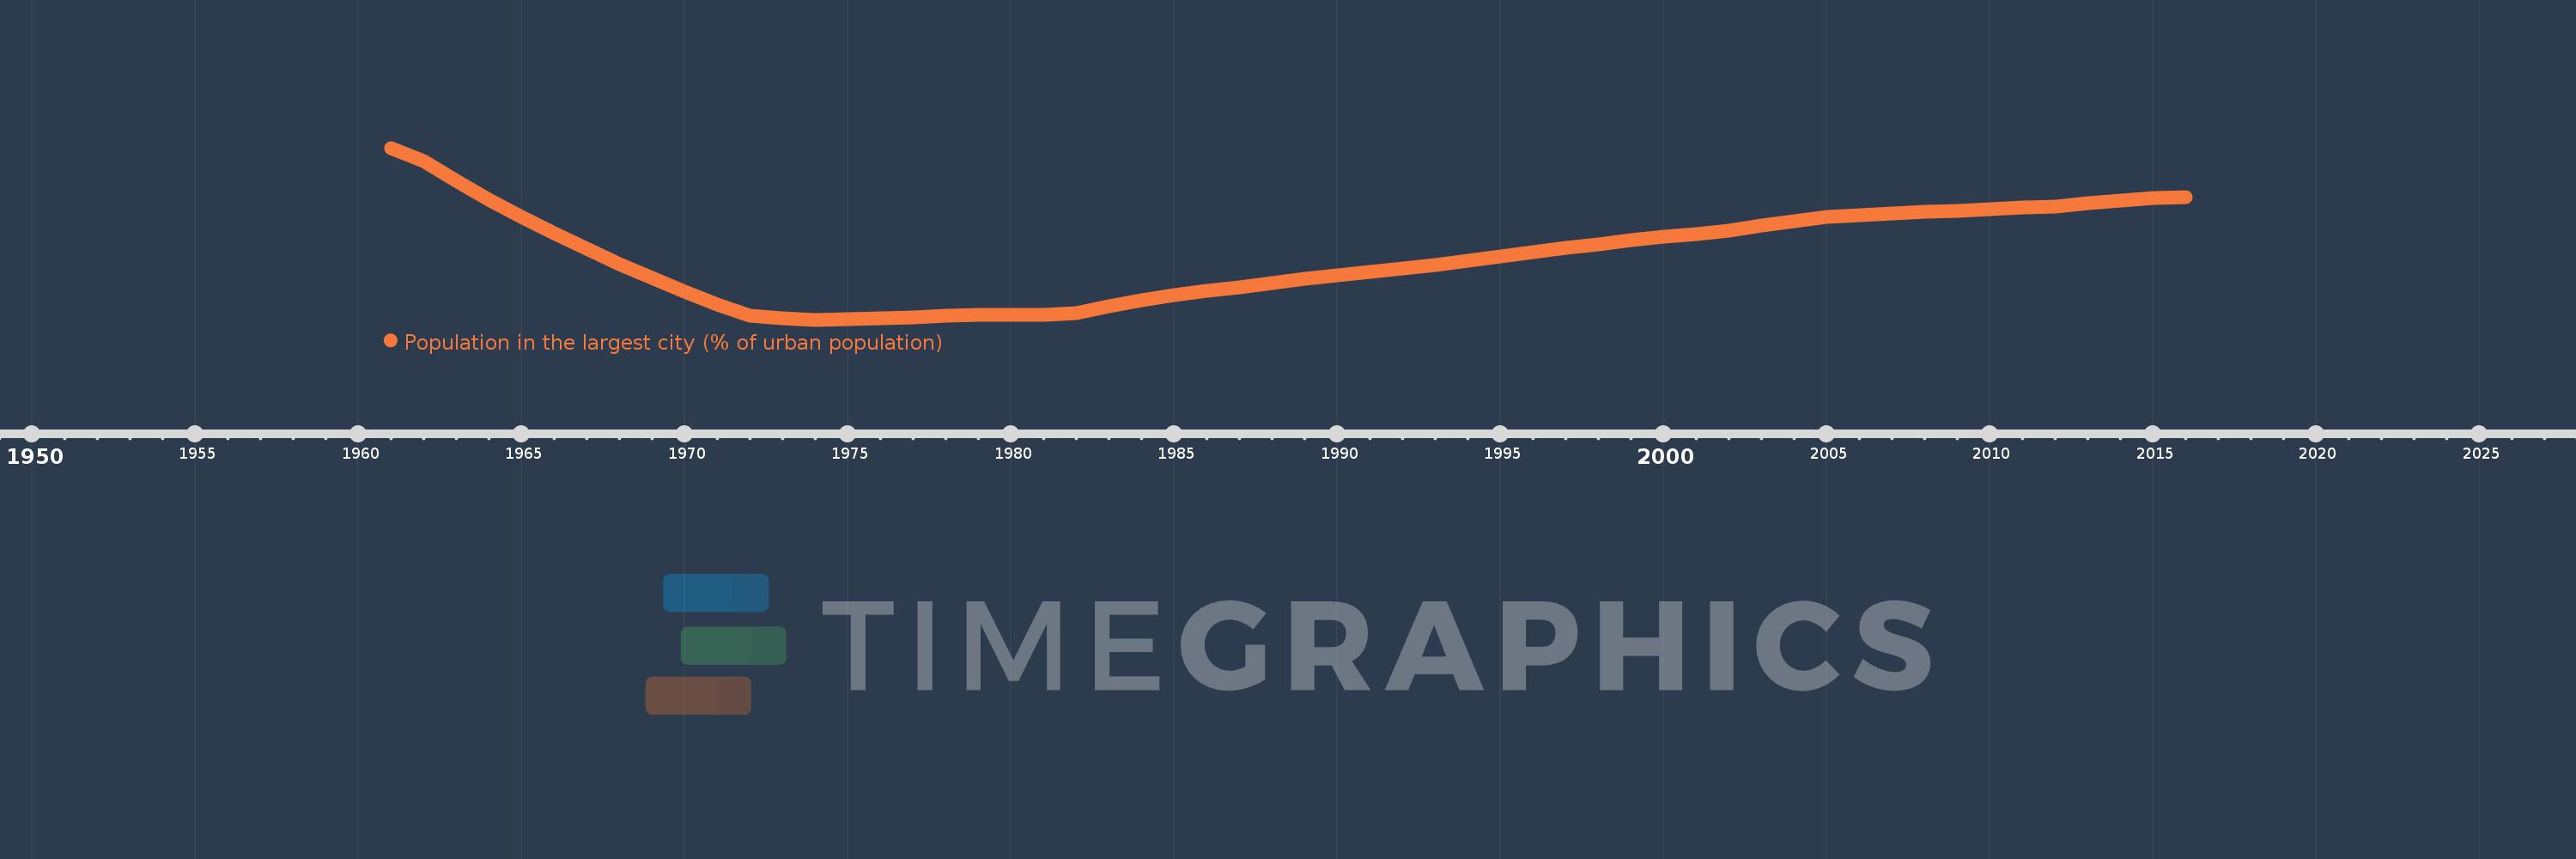
Population in the largest city (% of urban population)
2016,2015,2014,2013,2012,2011,2010,2009,2008,2007,2006,2005,2004,2003,2002,2001,2000,1999,1998,1997,1996,1995,1994,1993,1992,1991,1990,1989,1988,1987,1986,1985,1984,1983,1982,1981,1980,1979,1978,1977,1976,1975,1974,1973,1972,1971,1970,1969,1968,1967,1966,1965,1964,1963,1962,1961
This statistics in other country:
AfghanistanAlbaniaAlgeriaAngolaArab WorldArgentinaArmeniaAustraliaAustriaAzerbaijanBahrainBangladeshBelarusBelgiumBeninBoliviaBosnia and HerzegovinaBrazilBulgariaBurkina FasoBurundiCambodiaCameroonCanadaCentral African RepublicCentral Europe and the BalticsChadChileChinaColombiaCongo, Dem. Rep.Congo, Rep.Costa RicaCote d'IvoireCroatiaCubaCzech RepublicDenmarkDjiboutiDominican RepublicEarly-demographic dividendEast Asia & PacificEast Asia & Pacific (excluding high income)East Asia & Pacific (IDA & IBRD countries)EcuadorEgypt, Arab Rep.El SalvadorEritreaEstoniaEthiopiaEuro areaEurope & Central AsiaEurope & Central Asia (excluding high income)Europe & Central Asia (IDA & IBRD countries)European UnionFinlandFragile and conflict affected situationsFranceGabonGambia, TheGeorgiaGermanyGhanaGreeceGuatemalaGuineaGuinea-BissauHaitiHeavily indebted poor countries (HIPC)High incomeHondurasHong Kong SAR, ChinaHungaryIBRD onlyIDA & IBRD totalIDA blendIDA onlyIDA totalIndiaIndonesiaIran, Islamic Rep.IraqIrelandIsraelItalyJamaicaJapanJordanKazakhstanKenyaKorea, Dem. People’s Rep.Korea, Rep.KuwaitKyrgyz RepublicLao PDRLate-demographic dividendLatin America & Caribbean Latin America & Caribbean (excluding high income)Latin America & the Caribbean (IDA & IBRD countries)LatviaLeast developed countries: UN classificationLebanonLiberiaLibyaLithuaniaLow & middle incomeLow incomeLower middle incomeMacao SAR, ChinaMacedonia, FYRMadagascarMalawiMalaysiaMaliMauritaniaMexicoMiddle East & North AfricaMiddle East & North Africa (excluding high income)Middle East & North Africa (IDA & IBRD countries)Middle incomeMoldovaMongoliaMoroccoMozambiqueMyanmarNamibiaNepalNetherlandsNew ZealandNicaraguaNigerNigeriaNorth AmericaNorwayOECD membersOmanPakistanPanamaPapua New GuineaParaguayPeruPhilippinesPolandPortugalPost-demographic dividendPre-demographic dividendPuerto RicoQatarRomaniaRussian FederationRwandaSaudi ArabiaSenegalSerbiaSierra LeoneSingaporeSlovak RepublicSomaliaSouth AfricaSouth AsiaSouth Asia (IDA & IBRD)South SudanSpainSri LankaSub-Saharan Africa Sub-Saharan Africa (excluding high income)Sub-Saharan Africa (IDA & IBRD countries)SudanSwedenSwitzerlandSyrian Arab RepublicTajikistanTanzaniaThailandTogoTunisiaTurkeyTurkmenistanUgandaUkraineUnited Arab EmiratesUnited KingdomUnited StatesUpper middle incomeUruguayUzbekistanVenezuela, RBVietnamWest Bank and GazaWorldYemen, Rep.ZambiaZimbabwe Timeline:
This timeline shows a graph from 1961 to 2016 of United Kingdom. No data until 1960. Number of actual observations by date: 56.
Source name:
World Development Indicators
Source organization:
United Nations, World Urbanization Prospects.
Categories, topics:
Urban Development
Last updated:
apr 23, 2017
Indicators value changes by year
Minimum:
17.256
jan 1, 1974
Maximum:
19.939
jan 1, 1961
At the date of observation
Value
Absolute change
Change from previous value
jan 1, 1961
19.939
+19.939
0.0%
jan 1, 1962
19.739
-0.2
-1.0%
jan 1, 1963
19.424
-0.315
-1.6%
jan 1, 1964
19.133
-0.29
-1.49%
jan 1, 1965
18.866
-0.267
-1.4%
jan 1, 1966
18.604
-0.262
-1.39%
jan 1, 1967
18.363
-0.242
-1.3%
jan 1, 1968
18.127
-0.236
-1.28%
jan 1, 1969
17.904
-0.223
-1.23%
jan 1, 1970
17.696
-0.208
-1.16%
jan 1, 1971
17.494
-0.202
-1.14%
jan 1, 1972
17.318
-0.176
-1.01%
jan 1, 1973
17.274
-0.044
-0.25%
jan 1, 1974
17.256
-0.018
-0.1%
jan 1, 1975
17.26
+0.004
0.03%
jan 1, 1976
17.277
+0.017
0.1%
jan 1, 1977
17.298
+0.02
0.12%
jan 1, 1978
17.319
+0.022
0.13%
jan 1, 1979
17.335
+0.016
0.09%
jan 1, 1980
17.336
+0.001
0.01%
jan 1, 1981
17.332
-0.004
-0.02%
jan 1, 1982
17.364
+0.031
0.18%
jan 1, 1983
17.471
+0.107
0.62%
jan 1, 1984
17.567
+0.096
0.55%
jan 1, 1985
17.641
+0.074
0.42%
jan 1, 1986
17.703
+0.062
0.35%
jan 1, 1987
17.765
+0.062
0.35%
jan 1, 1988
17.831
+0.066
0.37%
jan 1, 1989
17.895
+0.064
0.36%
jan 1, 1990
17.953
+0.057
0.32%
jan 1, 1991
18.003
+0.051
0.28%
jan 1, 1992
18.055
+0.051
0.28%
jan 1, 1993
18.116
+0.061
0.34%
jan 1, 1994
18.182
+0.067
0.37%
jan 1, 1995
18.246
+0.064
0.35%
jan 1, 1996
18.309
+0.063
0.34%
jan 1, 1997
18.374
+0.065
0.35%
jan 1, 1998
18.438
+0.064
0.35%
jan 1, 1999
18.496
+0.058
0.32%
jan 1, 2000
18.547
+0.051
0.28%
jan 1, 2001
18.594
+0.047
0.25%
jan 1, 2002
18.644
+0.049
0.27%
jan 1, 2003
18.725
+0.081
0.44%
jan 1, 2004
18.8
+0.075
0.4%
jan 1, 2005
18.856
+0.057
0.3%
jan 1, 2006
18.892
+0.035
0.19%
jan 1, 2007
18.919
+0.027
0.14%
jan 1, 2008
18.939
+0.02
0.11%
jan 1, 2009
18.958
+0.02
0.1%
jan 1, 2010
18.984
+0.026
0.14%
jan 1, 2011
19.006
+0.022
0.12%
jan 1, 2012
19.029
+0.023
0.12%
jan 1, 2013
19.07
+0.041
0.22%
jan 1, 2014
19.118
+0.048
0.25%
jan 1, 2015
19.151
+0.033
0.17%
jan 1, 2016
19.17
+0.019
0.1%
Ranking of countries by current statistics by years


Comments: