29
/
en
AIzaSyAYiBZKx7MnpbEhh9jyipgxe19OcubqV5w
April 1, 2024
174596
Lao PDR
LAO
true
2
1
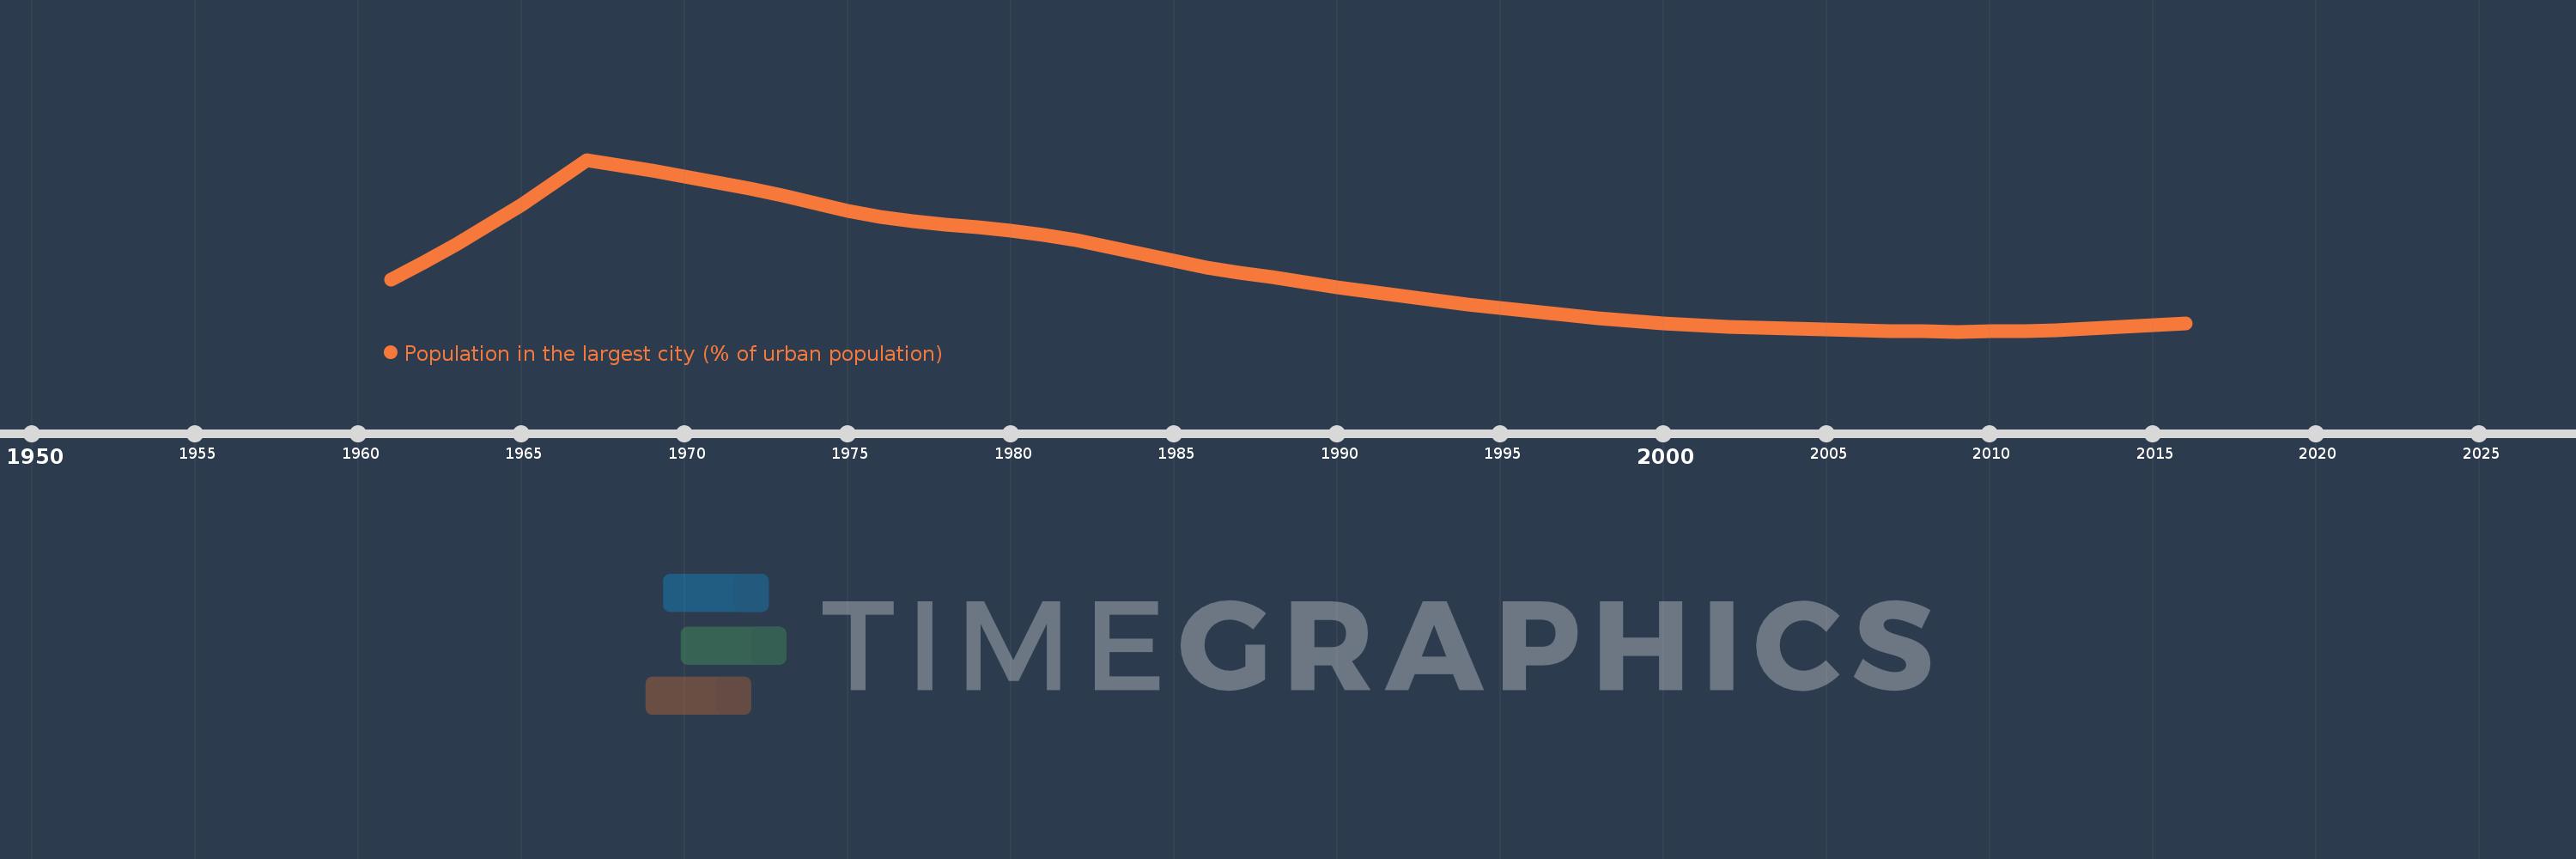
Population in the largest city (% of urban population)
2016,2015,2014,2013,2012,2011,2010,2009,2008,2007,2006,2005,2004,2003,2002,2001,2000,1999,1998,1997,1996,1995,1994,1993,1992,1991,1990,1989,1988,1987,1986,1985,1984,1983,1982,1981,1980,1979,1978,1977,1976,1975,1974,1973,1972,1971,1970,1969,1968,1967,1966,1965,1964,1963,1962,1961
This statistics in other country:
AfghanistanAlbaniaAlgeriaAngolaArab WorldArgentinaArmeniaAustraliaAustriaAzerbaijanBahrainBangladeshBelarusBelgiumBeninBoliviaBosnia and HerzegovinaBrazilBulgariaBurkina FasoBurundiCambodiaCameroonCanadaCentral African RepublicCentral Europe and the BalticsChadChileChinaColombiaCongo, Dem. Rep.Congo, Rep.Costa RicaCote d'IvoireCroatiaCubaCzech RepublicDenmarkDjiboutiDominican RepublicEarly-demographic dividendEast Asia & PacificEast Asia & Pacific (excluding high income)East Asia & Pacific (IDA & IBRD countries)EcuadorEgypt, Arab Rep.El SalvadorEritreaEstoniaEthiopiaEuro areaEurope & Central AsiaEurope & Central Asia (excluding high income)Europe & Central Asia (IDA & IBRD countries)European UnionFinlandFragile and conflict affected situationsFranceGabonGambia, TheGeorgiaGermanyGhanaGreeceGuatemalaGuineaGuinea-BissauHaitiHeavily indebted poor countries (HIPC)High incomeHondurasHong Kong SAR, ChinaHungaryIBRD onlyIDA & IBRD totalIDA blendIDA onlyIDA totalIndiaIndonesiaIran, Islamic Rep.IraqIrelandIsraelItalyJamaicaJapanJordanKazakhstanKenyaKorea, Dem. People’s Rep.Korea, Rep.KuwaitKyrgyz RepublicLao PDRLate-demographic dividendLatin America & Caribbean Latin America & Caribbean (excluding high income)Latin America & the Caribbean (IDA & IBRD countries)LatviaLeast developed countries: UN classificationLebanonLiberiaLibyaLithuaniaLow & middle incomeLow incomeLower middle incomeMacao SAR, ChinaMacedonia, FYRMadagascarMalawiMalaysiaMaliMauritaniaMexicoMiddle East & North AfricaMiddle East & North Africa (excluding high income)Middle East & North Africa (IDA & IBRD countries)Middle incomeMoldovaMongoliaMoroccoMozambiqueMyanmarNamibiaNepalNetherlandsNew ZealandNicaraguaNigerNigeriaNorth AmericaNorwayOECD membersOmanPakistanPanamaPapua New GuineaParaguayPeruPhilippinesPolandPortugalPost-demographic dividendPre-demographic dividendPuerto RicoQatarRomaniaRussian FederationRwandaSaudi ArabiaSenegalSerbiaSierra LeoneSingaporeSlovak RepublicSomaliaSouth AfricaSouth AsiaSouth Asia (IDA & IBRD)South SudanSpainSri LankaSub-Saharan Africa Sub-Saharan Africa (excluding high income)Sub-Saharan Africa (IDA & IBRD countries)SudanSwedenSwitzerlandSyrian Arab RepublicTajikistanTanzaniaThailandTogoTunisiaTurkeyTurkmenistanUgandaUkraineUnited Arab EmiratesUnited KingdomUnited StatesUpper middle incomeUruguayUzbekistanVenezuela, RBVietnamWest Bank and GazaWorldYemen, Rep.ZambiaZimbabwe Timeline:
This timeline shows a graph from 1961 to 2016 of Lao PDR. No data until 1960. Number of actual observations by date: 56.
Source name:
World Development Indicators
Source organization:
United Nations, World Urbanization Prospects.
Categories, topics:
Urban Development
Last updated:
apr 23, 2017
Indicators value changes by year
Minimum:
36.624
jan 1, 2009
Maximum:
64.592
jan 1, 1967
At the date of observation
Value
Absolute change
Change from previous value
jan 1, 1961
45.062
+45.062
0.0%
jan 1, 1962
47.856
+2.793
6.2%
jan 1, 1963
50.823
+2.967
6.2%
jan 1, 1964
53.973
+3.15
6.2%
jan 1, 1965
57.314
+3.342
6.19%
jan 1, 1966
60.836
+3.521
6.14%
jan 1, 1967
64.592
+3.756
6.17%
jan 1, 1968
63.695
-0.897
-1.39%
jan 1, 1969
62.794
-0.9
-1.41%
jan 1, 1970
61.864
-0.93
-1.48%
jan 1, 1971
60.885
-0.979
-1.58%
jan 1, 1972
59.846
-1.039
-1.71%
jan 1, 1973
58.779
-1.067
-1.78%
jan 1, 1974
57.586
-1.193
-2.03%
jan 1, 1975
56.32
-1.267
-2.2%
jan 1, 1976
55.32
-1.0
-1.78%
jan 1, 1977
54.591
-0.729
-1.32%
jan 1, 1978
54.074
-0.517
-0.95%
jan 1, 1979
53.636
-0.438
-0.81%
jan 1, 1980
53.12
-0.516
-0.96%
jan 1, 1981
52.417
-0.702
-1.32%
jan 1, 1982
51.521
-0.897
-1.71%
jan 1, 1983
50.468
-1.053
-2.04%
jan 1, 1984
49.316
-1.151
-2.28%
jan 1, 1985
48.124
-1.193
-2.42%
jan 1, 1986
47.061
-1.063
-2.21%
jan 1, 1987
46.265
-0.796
-1.69%
jan 1, 1988
45.463
-0.802
-1.73%
jan 1, 1989
44.669
-0.794
-1.75%
jan 1, 1990
43.888
-0.781
-1.75%
jan 1, 1991
43.127
-0.761
-1.73%
jan 1, 1992
42.391
-0.736
-1.71%
jan 1, 1993
41.692
-0.7
-1.65%
jan 1, 1994
41.043
-0.649
-1.56%
jan 1, 1995
40.469
-0.574
-1.4%
jan 1, 1996
39.904
-0.565
-1.4%
jan 1, 1997
39.281
-0.623
-1.56%
jan 1, 1998
38.752
-0.529
-1.35%
jan 1, 1999
38.312
-0.44
-1.14%
jan 1, 2000
37.948
-0.364
-0.95%
jan 1, 2001
37.653
-0.296
-0.78%
jan 1, 2002
37.424
-0.229
-0.61%
jan 1, 2003
37.254
-0.17
-0.45%
jan 1, 2004
37.124
-0.13
-0.35%
jan 1, 2005
37.004
-0.12
-0.32%
jan 1, 2006
36.876
-0.129
-0.35%
jan 1, 2007
36.762
-0.113
-0.31%
jan 1, 2008
36.675
-0.087
-0.24%
jan 1, 2009
36.624
-0.051
-0.14%
jan 1, 2010
36.629
+0.005
0.01%
jan 1, 2011
36.703
+0.074
0.2%
jan 1, 2012
36.848
+0.144
0.39%
jan 1, 2013
37.058
+0.21
0.57%
jan 1, 2014
37.328
+0.27
0.73%
jan 1, 2015
37.649
+0.321
0.86%
jan 1, 2016
37.942
+0.293
0.78%
Ranking of countries by current statistics by years


Comments: