29
/
en
AIzaSyAYiBZKx7MnpbEhh9jyipgxe19OcubqV5w
April 1, 2024
89736
Botswana
BWA
true
2
1
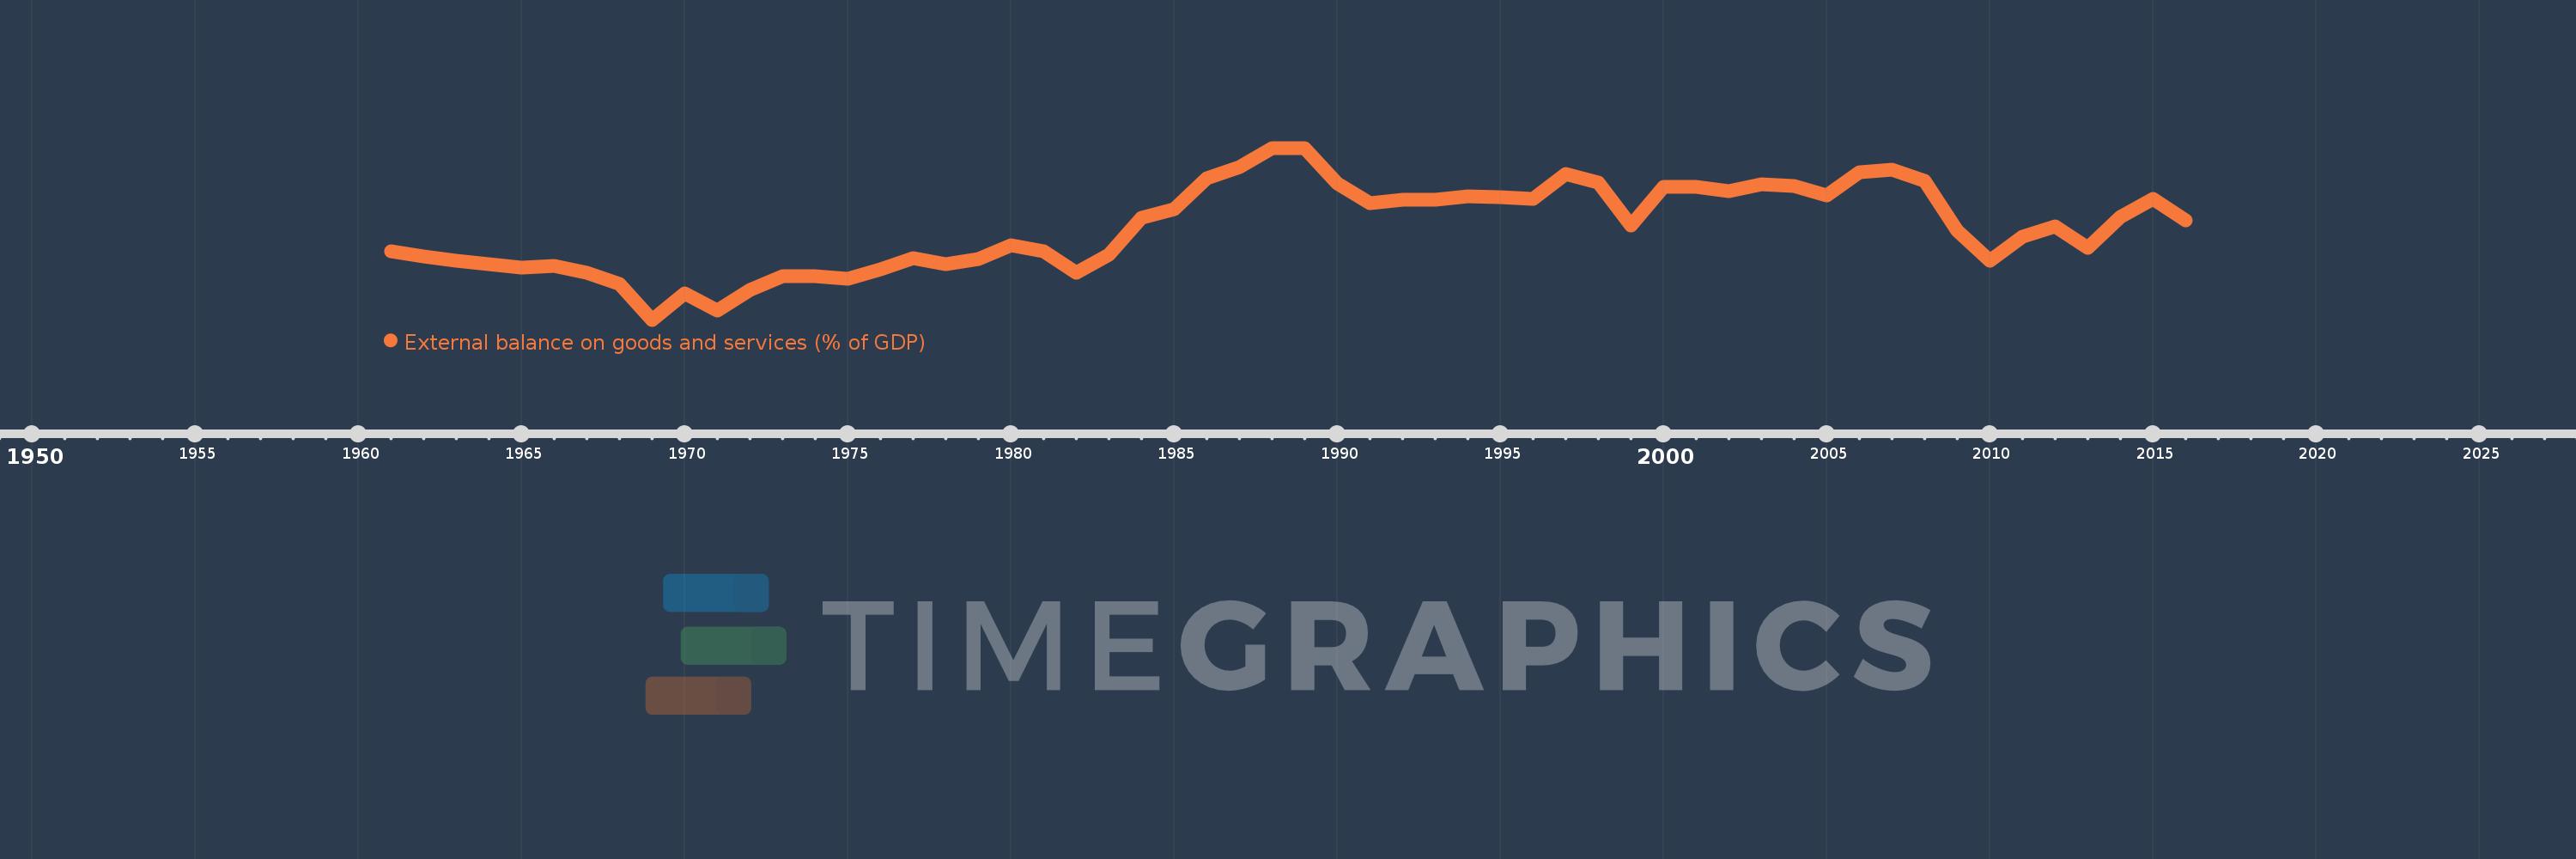
External balance on goods and services (% of GDP)
2016,2015,2014,2013,2012,2011,2010,2009,2008,2007,2006,2005,2004,2003,2002,2001,2000,1999,1998,1997,1996,1995,1994,1993,1992,1991,1990,1989,1988,1987,1986,1985,1984,1983,1982,1981,1980,1979,1978,1977,1976,1975,1974,1973,1972,1971,1970,1969,1968,1967,1966,1965,1964,1963,1962,1961
This statistics in other country:
AfghanistanAlbaniaAlgeriaAngolaAntigua and BarbudaArab WorldArgentinaArmeniaArubaAustraliaAustriaAzerbaijanBahamas, TheBahrainBangladeshBarbadosBelarusBelgiumBelizeBeninBermudaBhutanBoliviaBosnia and HerzegovinaBotswanaBrazilBrunei DarussalamBulgariaBurkina FasoBurundiCabo VerdeCambodiaCameroonCanadaCaribbean small statesCentral African RepublicCentral Europe and the BalticsChadChileChinaColombiaComorosCongo, Dem. Rep.Congo, Rep.Costa RicaCote d'IvoireCroatiaCubaCyprusCzech RepublicDenmarkDjiboutiDominicaDominican RepublicEarly-demographic dividendEast Asia & PacificEast Asia & Pacific (excluding high income)East Asia & Pacific (IDA & IBRD countries)EcuadorEgypt, Arab Rep.El SalvadorEquatorial GuineaEritreaEstoniaEthiopiaEuro areaEurope & Central AsiaEurope & Central Asia (excluding high income)Europe & Central Asia (IDA & IBRD countries)European UnionFaroe IslandsFijiFinlandFragile and conflict affected situationsFranceFrench PolynesiaGabonGambia, TheGeorgiaGermanyGhanaGreeceGrenadaGuatemalaGuineaGuinea-BissauGuyanaHaitiHeavily indebted poor countries (HIPC)High incomeHondurasHong Kong SAR, ChinaHungaryIBRD onlyIcelandIDA & IBRD totalIDA blendIDA onlyIDA totalIndiaIndonesiaIran, Islamic Rep.IraqIrelandIsraelItalyJamaicaJapanJordanKazakhstanKenyaKiribatiKorea, Rep.KosovoKuwaitKyrgyz RepublicLao PDRLate-demographic dividendLatin America & Caribbean Latin America & Caribbean (excluding high income)Latin America & the Caribbean (IDA & IBRD countries)LatviaLeast developed countries: UN classificationLebanonLesothoLiberiaLibyaLithuaniaLow & middle incomeLow incomeLower middle incomeLuxembourgMacao SAR, ChinaMacedonia, FYRMadagascarMalawiMalaysiaMaldivesMaliMaltaMauritaniaMauritiusMexicoMicronesia, Fed. Sts.Middle East & North AfricaMiddle East & North Africa (excluding high income)Middle East & North Africa (IDA & IBRD countries)Middle incomeMoldovaMongoliaMontenegroMoroccoMozambiqueMyanmarNamibiaNepalNetherlandsNew CaledoniaNew ZealandNicaraguaNigerNigeriaNorth AmericaNorwayOECD membersOmanOther small statesPacific island small statesPakistanPalauPanamaPapua New GuineaParaguayPeruPhilippinesPolandPortugalPost-demographic dividendPre-demographic dividendPuerto RicoQatarRomaniaRussian FederationRwandaSamoaSaudi ArabiaSenegalSerbiaSeychellesSierra LeoneSingaporeSlovak RepublicSloveniaSmall statesSolomon IslandsSomaliaSouth AfricaSouth AsiaSouth Asia (IDA & IBRD)South SudanSpainSri LankaSt. Kitts and NevisSt. LuciaSt. Vincent and the GrenadinesSub-Saharan Africa Sub-Saharan Africa (excluding high income)Sub-Saharan Africa (IDA & IBRD countries)SudanSurinameSwazilandSwedenSwitzerlandSyrian Arab RepublicTajikistanTanzaniaThailandTimor-LesteTogoTongaTrinidad and TobagoTunisiaTurkeyTurkmenistanUgandaUkraineUnited Arab EmiratesUnited KingdomUnited StatesUpper middle incomeUruguayUzbekistanVanuatuVenezuela, RBVietnamWest Bank and GazaWorldYemen, Rep.ZambiaZimbabwe Timeline:
This timeline shows a graph from 1961 to 2016 of Botswana. No data until 1960. Number of actual observations by date: 56.
Source name:
World Development Indicators
Source organization:
World Bank national accounts data, and OECD National Accounts data files.
Categories, topics:
Economy & Growth, Trade
Last updated:
apr 23, 2017
Indicators value changes by year
Minimum:
-39.895
jan 1, 1969
Maximum:
26.687
jan 1, 1988
At the date of observation
Value
Absolute change
Change from previous value
jan 1, 1961
-13.368
-13.368
0.0%
jan 1, 1962
-15.309
-1.941
14.52%
jan 1, 1963
-16.913
-1.604
10.48%
jan 1, 1964
-18.351
-1.438
8.5%
jan 1, 1965
-19.766
-1.415
7.71%
jan 1, 1966
-18.902
+0.863
-4.37%
jan 1, 1967
-21.68
-2.778
14.7%
jan 1, 1968
-26.16
-4.479
20.66%
jan 1, 1969
-39.895
-13.735
52.5%
jan 1, 1970
-29.793
+10.102
-25.32%
jan 1, 1971
-36.258
-6.465
21.7%
jan 1, 1972
-28.414
+7.844
-21.63%
jan 1, 1973
-23.171
+5.243
-18.45%
jan 1, 1974
-23.134
+0.037
-0.16%
jan 1, 1975
-23.852
-0.718
3.1%
jan 1, 1976
-20.198
+3.654
-15.32%
jan 1, 1977
-15.935
+4.263
-21.11%
jan 1, 1978
-18.409
-2.474
15.52%
jan 1, 1979
-16.464
+1.945
-10.57%
jan 1, 1980
-11.127
+5.337
-32.42%
jan 1, 1981
-13.383
-2.256
20.28%
jan 1, 1982
-21.825
-8.442
63.08%
jan 1, 1983
-14.712
+7.113
-32.59%
jan 1, 1984
-0.482
+14.23
-96.72%
jan 1, 1985
2.849
+3.331
-690.88%
jan 1, 1986
15.059
+12.21
428.57%
jan 1, 1987
19.202
+4.143
27.51%
jan 1, 1988
26.687
+7.485
38.98%
jan 1, 1989
26.592
-0.095
-0.36%
jan 1, 1990
13.088
-13.504
-50.78%
jan 1, 1991
5.263
-7.825
-59.78%
jan 1, 1992
6.501
+1.237
23.5%
jan 1, 1993
6.608
+0.107
1.65%
jan 1, 1994
7.983
+1.376
20.82%
jan 1, 1995
7.464
-0.519
-6.5%
jan 1, 1996
7.078
-0.386
-5.18%
jan 1, 1997
16.701
+9.623
135.97%
jan 1, 1998
13.157
-3.544
-21.22%
jan 1, 1999
-3.263
-16.42
-124.8%
jan 1, 2000
11.465
+14.728
-451.41%
jan 1, 2001
11.739
+0.273
2.38%
jan 1, 2002
9.79
-1.949
-16.6%
jan 1, 2003
12.479
+2.689
27.47%
jan 1, 2004
11.82
-0.659
-5.28%
jan 1, 2005
8.23
-3.59
-30.37%
jan 1, 2006
17.342
+9.112
110.72%
jan 1, 2007
18.174
+0.833
4.8%
jan 1, 2008
13.928
-4.247
-23.37%
jan 1, 2009
-5.368
-19.296
-138.54%
jan 1, 2010
-17.084
-11.716
218.26%
jan 1, 2011
-7.629
+9.455
-55.35%
jan 1, 2012
-3.568
+4.061
-53.24%
jan 1, 2013
-11.933
-8.366
234.49%
jan 1, 2014
0.076
+12.01
-100.64%
jan 1, 2015
7.052
+6.976
9.13K%
jan 1, 2016
-1.327
-8.379
-118.81%
Ranking of countries by current statistics by years


Comments: