29
/
en
AIzaSyAYiBZKx7MnpbEhh9jyipgxe19OcubqV5w
April 1, 2024
120882
Dominica
DMA
true
2
1
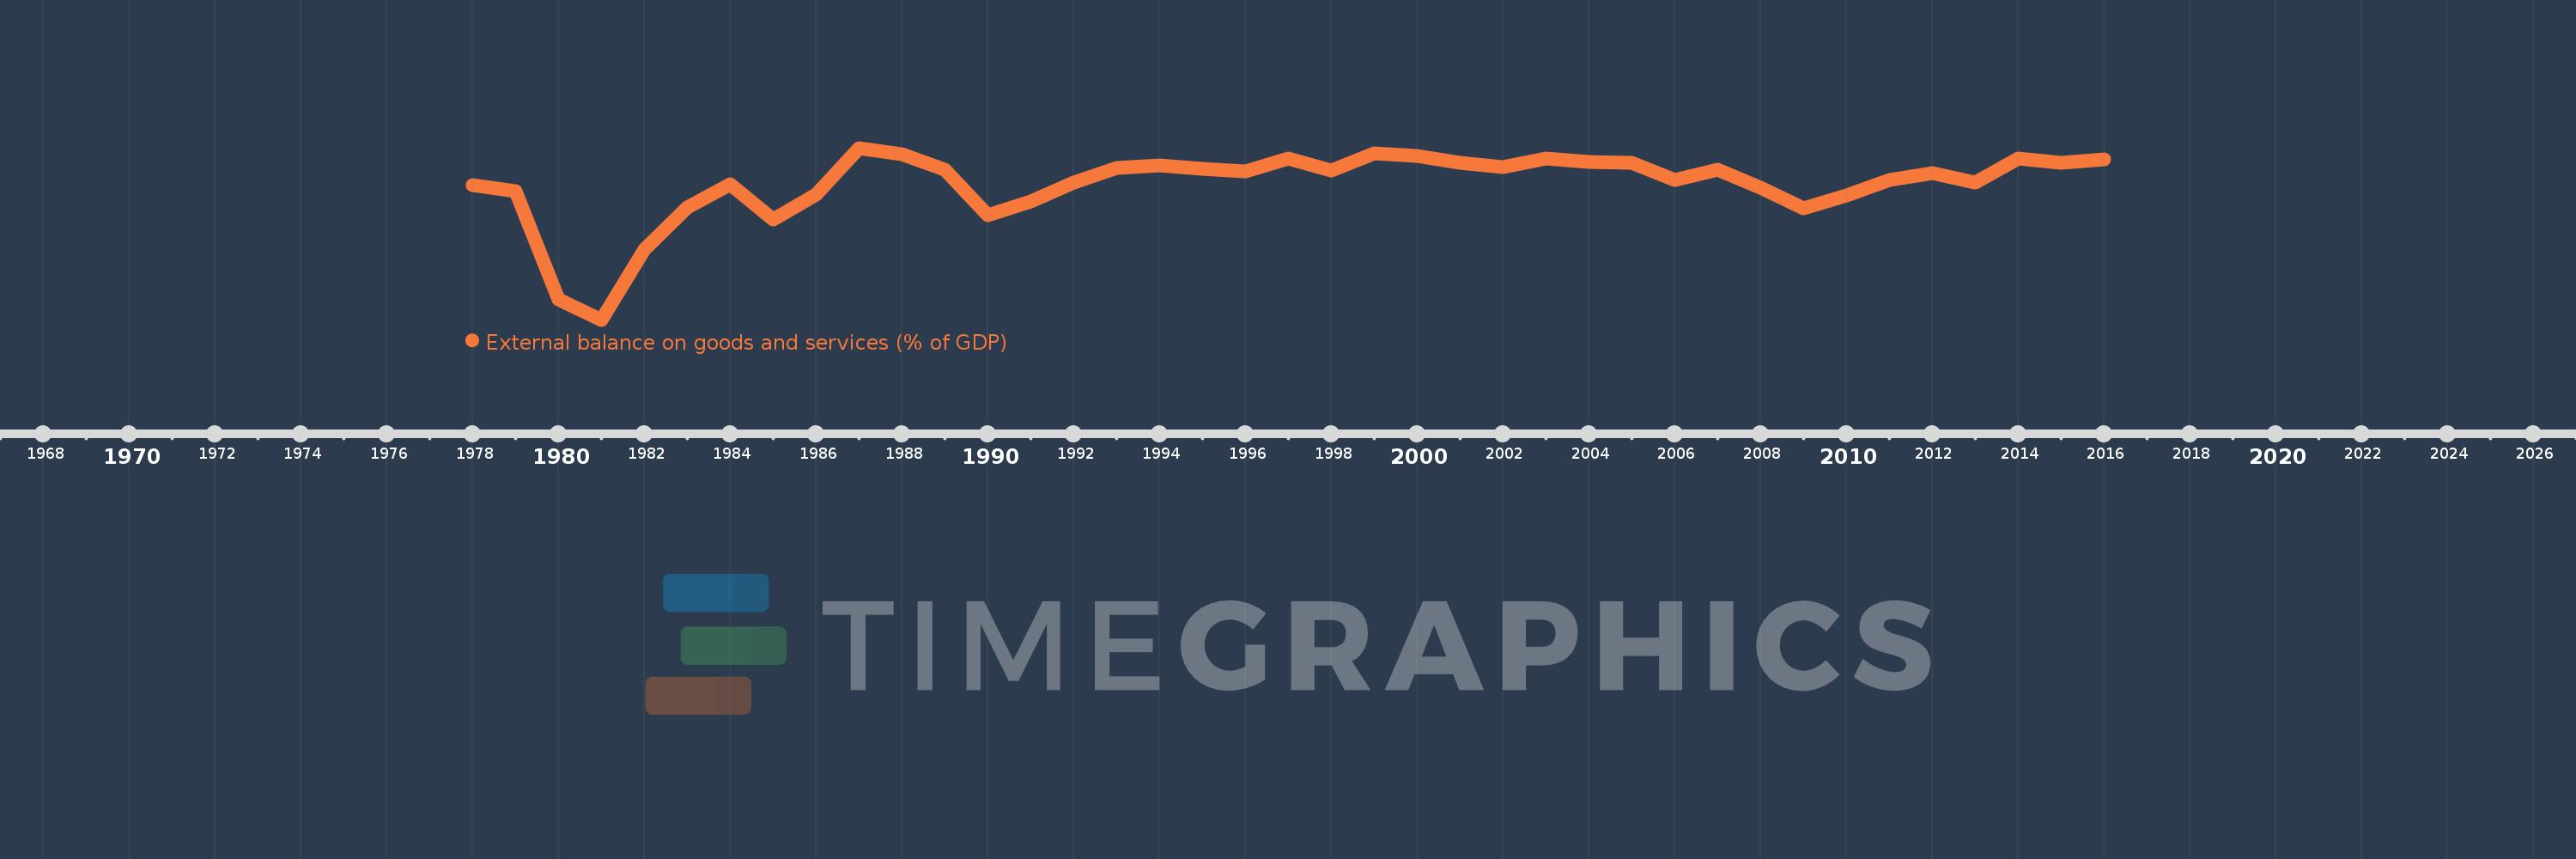
External balance on goods and services (% of GDP)
2016,2015,2014,2013,2012,2011,2010,2009,2008,2007,2006,2005,2004,2003,2002,2001,2000,1999,1998,1997,1996,1995,1994,1993,1992,1991,1990,1989,1988,1987,1986,1985,1984,1983,1982,1981,1980,1979,1978
This statistics in other country:
AfghanistanAlbaniaAlgeriaAngolaAntigua and BarbudaArab WorldArgentinaArmeniaArubaAustraliaAustriaAzerbaijanBahamas, TheBahrainBangladeshBarbadosBelarusBelgiumBelizeBeninBermudaBhutanBoliviaBosnia and HerzegovinaBotswanaBrazilBrunei DarussalamBulgariaBurkina FasoBurundiCabo VerdeCambodiaCameroonCanadaCaribbean small statesCentral African RepublicCentral Europe and the BalticsChadChileChinaColombiaComorosCongo, Dem. Rep.Congo, Rep.Costa RicaCote d'IvoireCroatiaCubaCyprusCzech RepublicDenmarkDjiboutiDominicaDominican RepublicEarly-demographic dividendEast Asia & PacificEast Asia & Pacific (excluding high income)East Asia & Pacific (IDA & IBRD countries)EcuadorEgypt, Arab Rep.El SalvadorEquatorial GuineaEritreaEstoniaEthiopiaEuro areaEurope & Central AsiaEurope & Central Asia (excluding high income)Europe & Central Asia (IDA & IBRD countries)European UnionFaroe IslandsFijiFinlandFragile and conflict affected situationsFranceFrench PolynesiaGabonGambia, TheGeorgiaGermanyGhanaGreeceGrenadaGuatemalaGuineaGuinea-BissauGuyanaHaitiHeavily indebted poor countries (HIPC)High incomeHondurasHong Kong SAR, ChinaHungaryIBRD onlyIcelandIDA & IBRD totalIDA blendIDA onlyIDA totalIndiaIndonesiaIran, Islamic Rep.IraqIrelandIsraelItalyJamaicaJapanJordanKazakhstanKenyaKiribatiKorea, Rep.KosovoKuwaitKyrgyz RepublicLao PDRLate-demographic dividendLatin America & Caribbean Latin America & Caribbean (excluding high income)Latin America & the Caribbean (IDA & IBRD countries)LatviaLeast developed countries: UN classificationLebanonLesothoLiberiaLibyaLithuaniaLow & middle incomeLow incomeLower middle incomeLuxembourgMacao SAR, ChinaMacedonia, FYRMadagascarMalawiMalaysiaMaldivesMaliMaltaMauritaniaMauritiusMexicoMicronesia, Fed. Sts.Middle East & North AfricaMiddle East & North Africa (excluding high income)Middle East & North Africa (IDA & IBRD countries)Middle incomeMoldovaMongoliaMontenegroMoroccoMozambiqueMyanmarNamibiaNepalNetherlandsNew CaledoniaNew ZealandNicaraguaNigerNigeriaNorth AmericaNorwayOECD membersOmanOther small statesPacific island small statesPakistanPalauPanamaPapua New GuineaParaguayPeruPhilippinesPolandPortugalPost-demographic dividendPre-demographic dividendPuerto RicoQatarRomaniaRussian FederationRwandaSamoaSaudi ArabiaSenegalSerbiaSeychellesSierra LeoneSingaporeSlovak RepublicSloveniaSmall statesSolomon IslandsSomaliaSouth AfricaSouth AsiaSouth Asia (IDA & IBRD)South SudanSpainSri LankaSt. Kitts and NevisSt. LuciaSt. Vincent and the GrenadinesSub-Saharan Africa Sub-Saharan Africa (excluding high income)Sub-Saharan Africa (IDA & IBRD countries)SudanSurinameSwazilandSwedenSwitzerlandSyrian Arab RepublicTajikistanTanzaniaThailandTimor-LesteTogoTongaTrinidad and TobagoTunisiaTurkeyTurkmenistanUgandaUkraineUnited Arab EmiratesUnited KingdomUnited StatesUpper middle incomeUruguayUzbekistanVanuatuVenezuela, RBVietnamWest Bank and GazaWorldYemen, Rep.ZambiaZimbabwe Timeline:
This timeline shows a graph from 1978 to 2016 of Dominica. No data until 1977. Number of actual observations by date: 39.
Source name:
World Development Indicators
Source organization:
World Bank national accounts data, and OECD National Accounts data files.
Categories, topics:
Economy & Growth, Trade
Last updated:
apr 23, 2017
Indicators value changes by year
Minimum:
-70.565
jan 1, 1981
Maximum:
-5.889
jan 1, 1987
At the date of observation
Value
Absolute change
Change from previous value
jan 1, 1978
-19.756
-19.756
0.0%
jan 1, 1979
-22.138
-2.383
12.06%
jan 1, 1980
-62.96
-40.821
184.39%
jan 1, 1981
-70.565
-7.605
12.08%
jan 1, 1982
-44.13
+26.435
-37.46%
jan 1, 1983
-28.323
+15.807
-35.82%
jan 1, 1984
-19.416
+8.907
-31.45%
jan 1, 1985
-32.771
-13.355
68.78%
jan 1, 1986
-23.409
+9.362
-28.57%
jan 1, 1987
-5.889
+17.52
-74.84%
jan 1, 1988
-8.108
-2.219
37.68%
jan 1, 1989
-14.141
-6.033
74.4%
jan 1, 1990
-31.267
-17.126
121.11%
jan 1, 1991
-25.991
+5.276
-16.87%
jan 1, 1992
-18.845
+7.146
-27.49%
jan 1, 1993
-13.321
+5.524
-29.31%
jan 1, 1994
-12.454
+0.868
-6.51%
jan 1, 1995
-13.738
-1.285
10.31%
jan 1, 1996
-14.596
-0.858
6.24%
jan 1, 1997
-10.023
+4.572
-31.33%
jan 1, 1998
-14.527
-4.503
44.93%
jan 1, 1999
-7.964
+6.563
-45.18%
jan 1, 2000
-8.881
-0.917
11.52%
jan 1, 2001
-11.483
-2.603
29.31%
jan 1, 2002
-12.969
-1.486
12.94%
jan 1, 2003
-9.792
+3.177
-24.5%
jan 1, 2004
-11.119
-1.327
13.55%
jan 1, 2005
-11.643
-0.524
4.71%
jan 1, 2006
-18.1
-6.457
55.46%
jan 1, 2007
-13.947
+4.153
-22.95%
jan 1, 2008
-21.0
-7.053
50.57%
jan 1, 2009
-28.501
-7.501
35.72%
jan 1, 2010
-23.824
+4.677
-16.41%
jan 1, 2011
-17.997
+5.827
-24.46%
jan 1, 2012
-15.277
+2.72
-15.12%
jan 1, 2013
-18.834
-3.557
23.29%
jan 1, 2014
-9.872
+8.962
-47.58%
jan 1, 2015
-11.539
-1.667
16.88%
jan 1, 2016
-10.336
+1.202
-10.42%
Ranking of countries by current statistics by years


Comments: