29
/
en
AIzaSyAYiBZKx7MnpbEhh9jyipgxe19OcubqV5w
April 1, 2024
58882
Sub-Saharan Africa
SSF
false
2
1
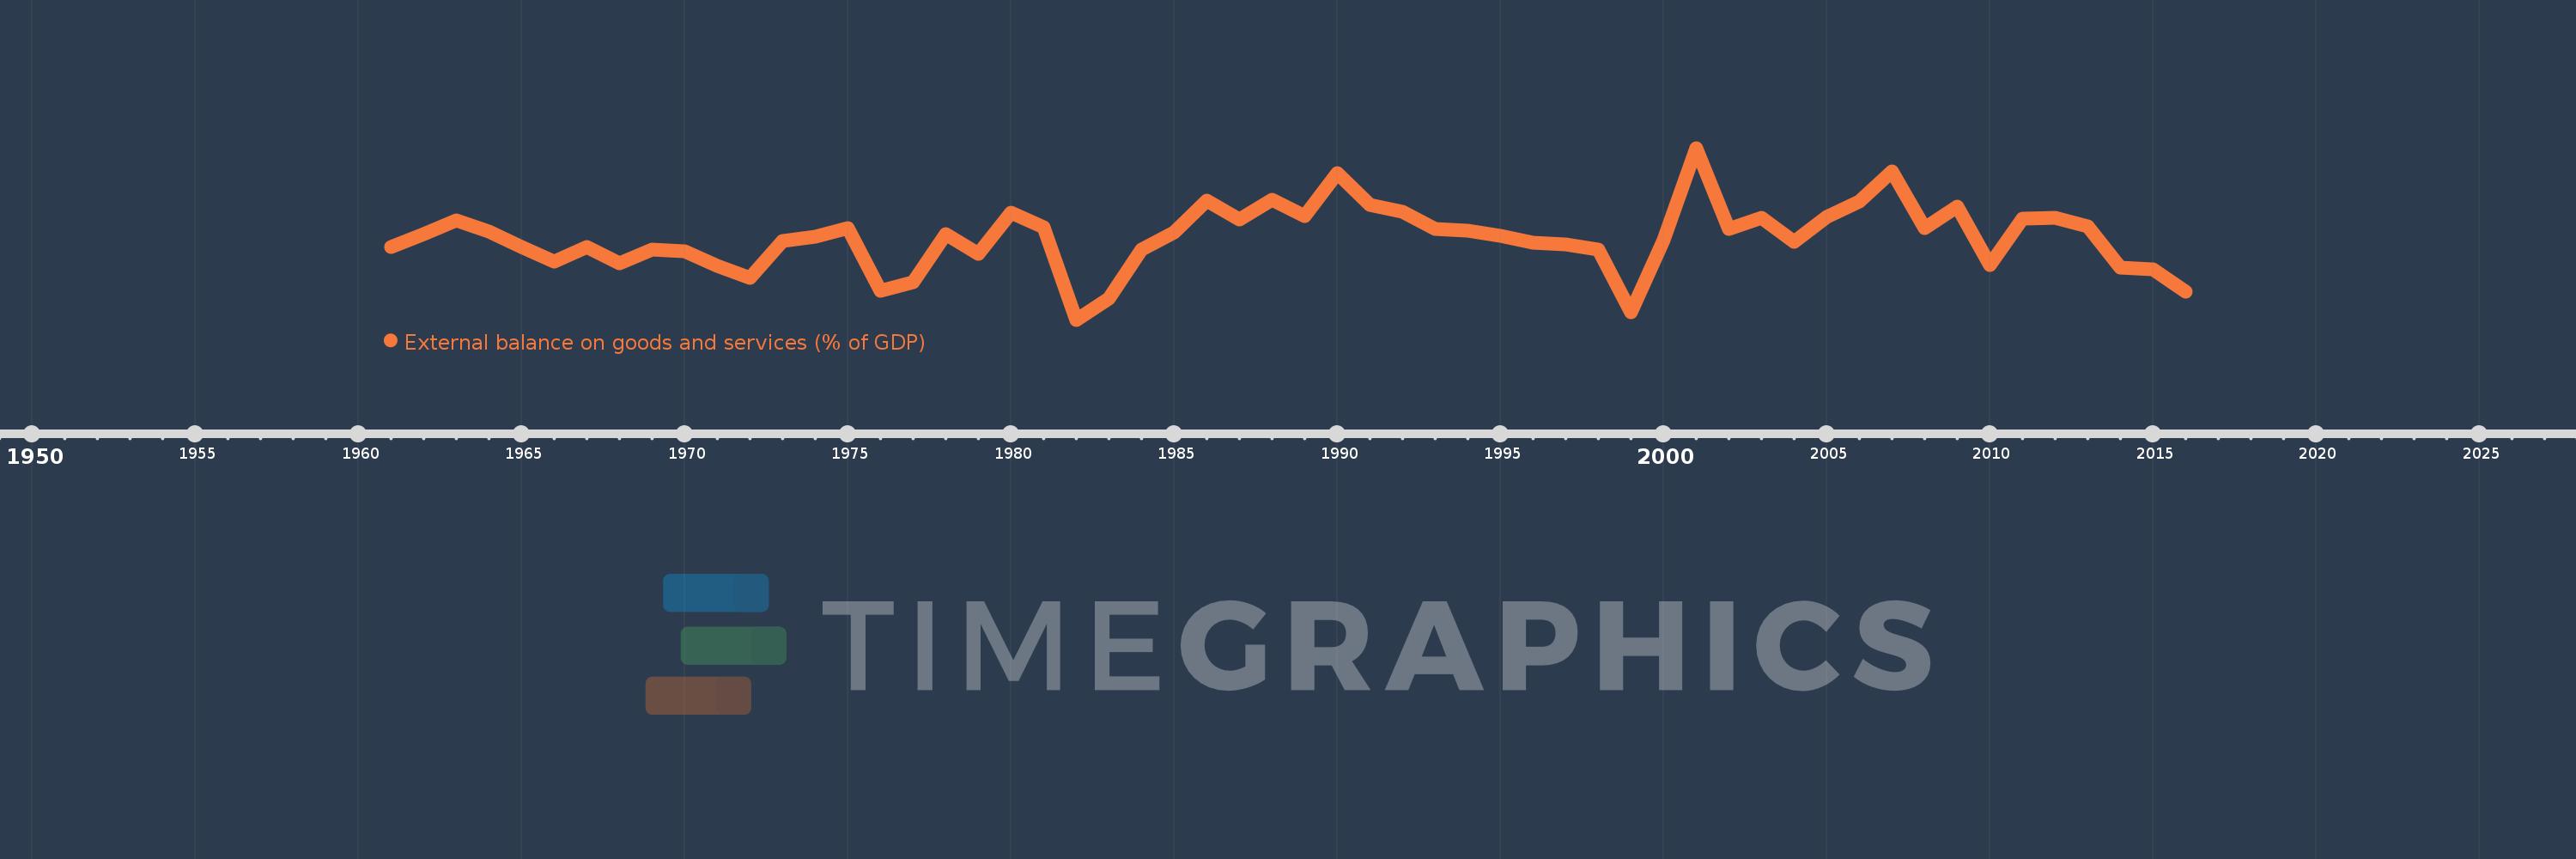
External balance on goods and services (% of GDP)
2016,2015,2014,2013,2012,2011,2010,2009,2008,2007,2006,2005,2004,2003,2002,2001,2000,1999,1998,1997,1996,1995,1994,1993,1992,1991,1990,1989,1988,1987,1986,1985,1984,1983,1982,1981,1980,1979,1978,1977,1976,1975,1974,1973,1972,1971,1970,1969,1968,1967,1966,1965,1964,1963,1962,1961
This statistics in other country:
AfghanistanAlbaniaAlgeriaAngolaAntigua and BarbudaArab WorldArgentinaArmeniaArubaAustraliaAustriaAzerbaijanBahamas, TheBahrainBangladeshBarbadosBelarusBelgiumBelizeBeninBermudaBhutanBoliviaBosnia and HerzegovinaBotswanaBrazilBrunei DarussalamBulgariaBurkina FasoBurundiCabo VerdeCambodiaCameroonCanadaCaribbean small statesCentral African RepublicCentral Europe and the BalticsChadChileChinaColombiaComorosCongo, Dem. Rep.Congo, Rep.Costa RicaCote d'IvoireCroatiaCubaCyprusCzech RepublicDenmarkDjiboutiDominicaDominican RepublicEarly-demographic dividendEast Asia & PacificEast Asia & Pacific (excluding high income)East Asia & Pacific (IDA & IBRD countries)EcuadorEgypt, Arab Rep.El SalvadorEquatorial GuineaEritreaEstoniaEthiopiaEuro areaEurope & Central AsiaEurope & Central Asia (excluding high income)Europe & Central Asia (IDA & IBRD countries)European UnionFaroe IslandsFijiFinlandFragile and conflict affected situationsFranceFrench PolynesiaGabonGambia, TheGeorgiaGermanyGhanaGreeceGrenadaGuatemalaGuineaGuinea-BissauGuyanaHaitiHeavily indebted poor countries (HIPC)High incomeHondurasHong Kong SAR, ChinaHungaryIBRD onlyIcelandIDA & IBRD totalIDA blendIDA onlyIDA totalIndiaIndonesiaIran, Islamic Rep.IraqIrelandIsraelItalyJamaicaJapanJordanKazakhstanKenyaKiribatiKorea, Rep.KosovoKuwaitKyrgyz RepublicLao PDRLate-demographic dividendLatin America & Caribbean Latin America & Caribbean (excluding high income)Latin America & the Caribbean (IDA & IBRD countries)LatviaLeast developed countries: UN classificationLebanonLesothoLiberiaLibyaLithuaniaLow & middle incomeLow incomeLower middle incomeLuxembourgMacao SAR, ChinaMacedonia, FYRMadagascarMalawiMalaysiaMaldivesMaliMaltaMauritaniaMauritiusMexicoMicronesia, Fed. Sts.Middle East & North AfricaMiddle East & North Africa (excluding high income)Middle East & North Africa (IDA & IBRD countries)Middle incomeMoldovaMongoliaMontenegroMoroccoMozambiqueMyanmarNamibiaNepalNetherlandsNew CaledoniaNew ZealandNicaraguaNigerNigeriaNorth AmericaNorwayOECD membersOmanOther small statesPacific island small statesPakistanPalauPanamaPapua New GuineaParaguayPeruPhilippinesPolandPortugalPost-demographic dividendPre-demographic dividendPuerto RicoQatarRomaniaRussian FederationRwandaSamoaSaudi ArabiaSenegalSerbiaSeychellesSierra LeoneSingaporeSlovak RepublicSloveniaSmall statesSolomon IslandsSomaliaSouth AfricaSouth AsiaSouth Asia (IDA & IBRD)South SudanSpainSri LankaSt. Kitts and NevisSt. LuciaSt. Vincent and the GrenadinesSub-Saharan Africa Sub-Saharan Africa (excluding high income)Sub-Saharan Africa (IDA & IBRD countries)SudanSurinameSwazilandSwedenSwitzerlandSyrian Arab RepublicTajikistanTanzaniaThailandTimor-LesteTogoTongaTrinidad and TobagoTunisiaTurkeyTurkmenistanUgandaUkraineUnited Arab EmiratesUnited KingdomUnited StatesUpper middle incomeUruguayUzbekistanVanuatuVenezuela, RBVietnamWest Bank and GazaWorldYemen, Rep.ZambiaZimbabwe Timeline:
This timeline shows a graph from 1961 to 2016 of Sub-Saharan Africa . No data until 1960. Number of actual observations by date: 56.
Source name:
World Development Indicators
Source organization:
World Bank national accounts data, and OECD National Accounts data files.
Categories, topics:
Economy & Growth, Trade
Last updated:
apr 23, 2017
Indicators value changes by year
At the date of observation
Value
Absolute change
Change from previous value
jan 1, 1961
-1.228
-1.228
0.0%
jan 1, 1962
-0.143
+1.085
-88.35%
jan 1, 1963
1.113
+1.256
-878.55%
jan 1, 1964
0.11
-1.003
-90.13%
jan 1, 1965
-1.256
-1.366
-1.24K%
jan 1, 1966
-2.554
-1.297
103.3%
jan 1, 1967
-1.268
+1.285
-50.33%
jan 1, 1968
-2.685
-1.417
111.69%
jan 1, 1969
-1.521
+1.164
-43.35%
jan 1, 1970
-1.612
-0.091
6.01%
jan 1, 1971
-2.928
-1.315
81.58%
jan 1, 1972
-4.007
-1.079
36.86%
jan 1, 1973
-0.749
+3.258
-81.32%
jan 1, 1974
-0.349
+0.399
-53.34%
jan 1, 1975
0.419
+0.768
-219.86%
jan 1, 1976
-5.114
-5.533
-1.32K%
jan 1, 1977
-4.399
+0.715
-13.98%
jan 1, 1978
-0.129
+4.27
-97.06%
jan 1, 1979
-1.858
-1.729
1.34K%
jan 1, 1980
1.78
+3.638
-195.81%
jan 1, 1981
0.482
-1.298
-72.92%
jan 1, 1982
-7.67
-8.152
-1.69K%
jan 1, 1983
-5.804
+1.866
-24.33%
jan 1, 1984
-1.469
+4.335
-74.69%
jan 1, 1985
-0.006
+1.463
-99.62%
jan 1, 1986
2.825
+2.83
-50.18K%
jan 1, 1987
1.167
-1.658
-58.69%
jan 1, 1988
2.91
+1.743
149.38%
jan 1, 1989
1.429
-1.481
-50.9%
jan 1, 1990
5.281
+3.852
269.63%
jan 1, 1991
2.441
-2.84
-53.77%
jan 1, 1992
1.822
-0.62
-25.38%
jan 1, 1993
0.364
-1.457
-80.0%
jan 1, 1994
0.161
-0.203
-55.79%
jan 1, 1995
-0.243
-0.404
-250.96%
jan 1, 1996
-0.868
-0.625
256.95%
jan 1, 1997
-1.028
-0.16
18.38%
jan 1, 1998
-1.509
-0.482
46.86%
jan 1, 1999
-7.04
-5.53
366.36%
jan 1, 2000
-0.69
+6.35
-90.2%
jan 1, 2001
7.464
+8.154
-1.18K%
jan 1, 2002
0.293
-7.171
-96.08%
jan 1, 2003
1.288
+0.995
339.71%
jan 1, 2004
-0.796
-2.084
-161.81%
jan 1, 2005
1.378
+2.174
-273.14%
jan 1, 2006
2.721
+1.343
97.42%
jan 1, 2007
5.394
+2.673
98.25%
jan 1, 2008
0.399
-4.995
-92.61%
jan 1, 2009
2.291
+1.893
474.87%
jan 1, 2010
-2.88
-5.171
-225.68%
jan 1, 2011
1.211
+4.09
-142.06%
jan 1, 2012
1.295
+0.084
6.93%
jan 1, 2013
0.556
-0.739
-57.08%
jan 1, 2014
-3.084
-3.64
-654.82%
jan 1, 2015
-3.193
-0.109
3.55%
jan 1, 2016
-5.185
-1.992
62.37%
Ranking of countries by current statistics by years


Comments: