29
/
en
AIzaSyAYiBZKx7MnpbEhh9jyipgxe19OcubqV5w
April 1, 2024
55484
Pre-demographic dividend
PRE
false
2
1
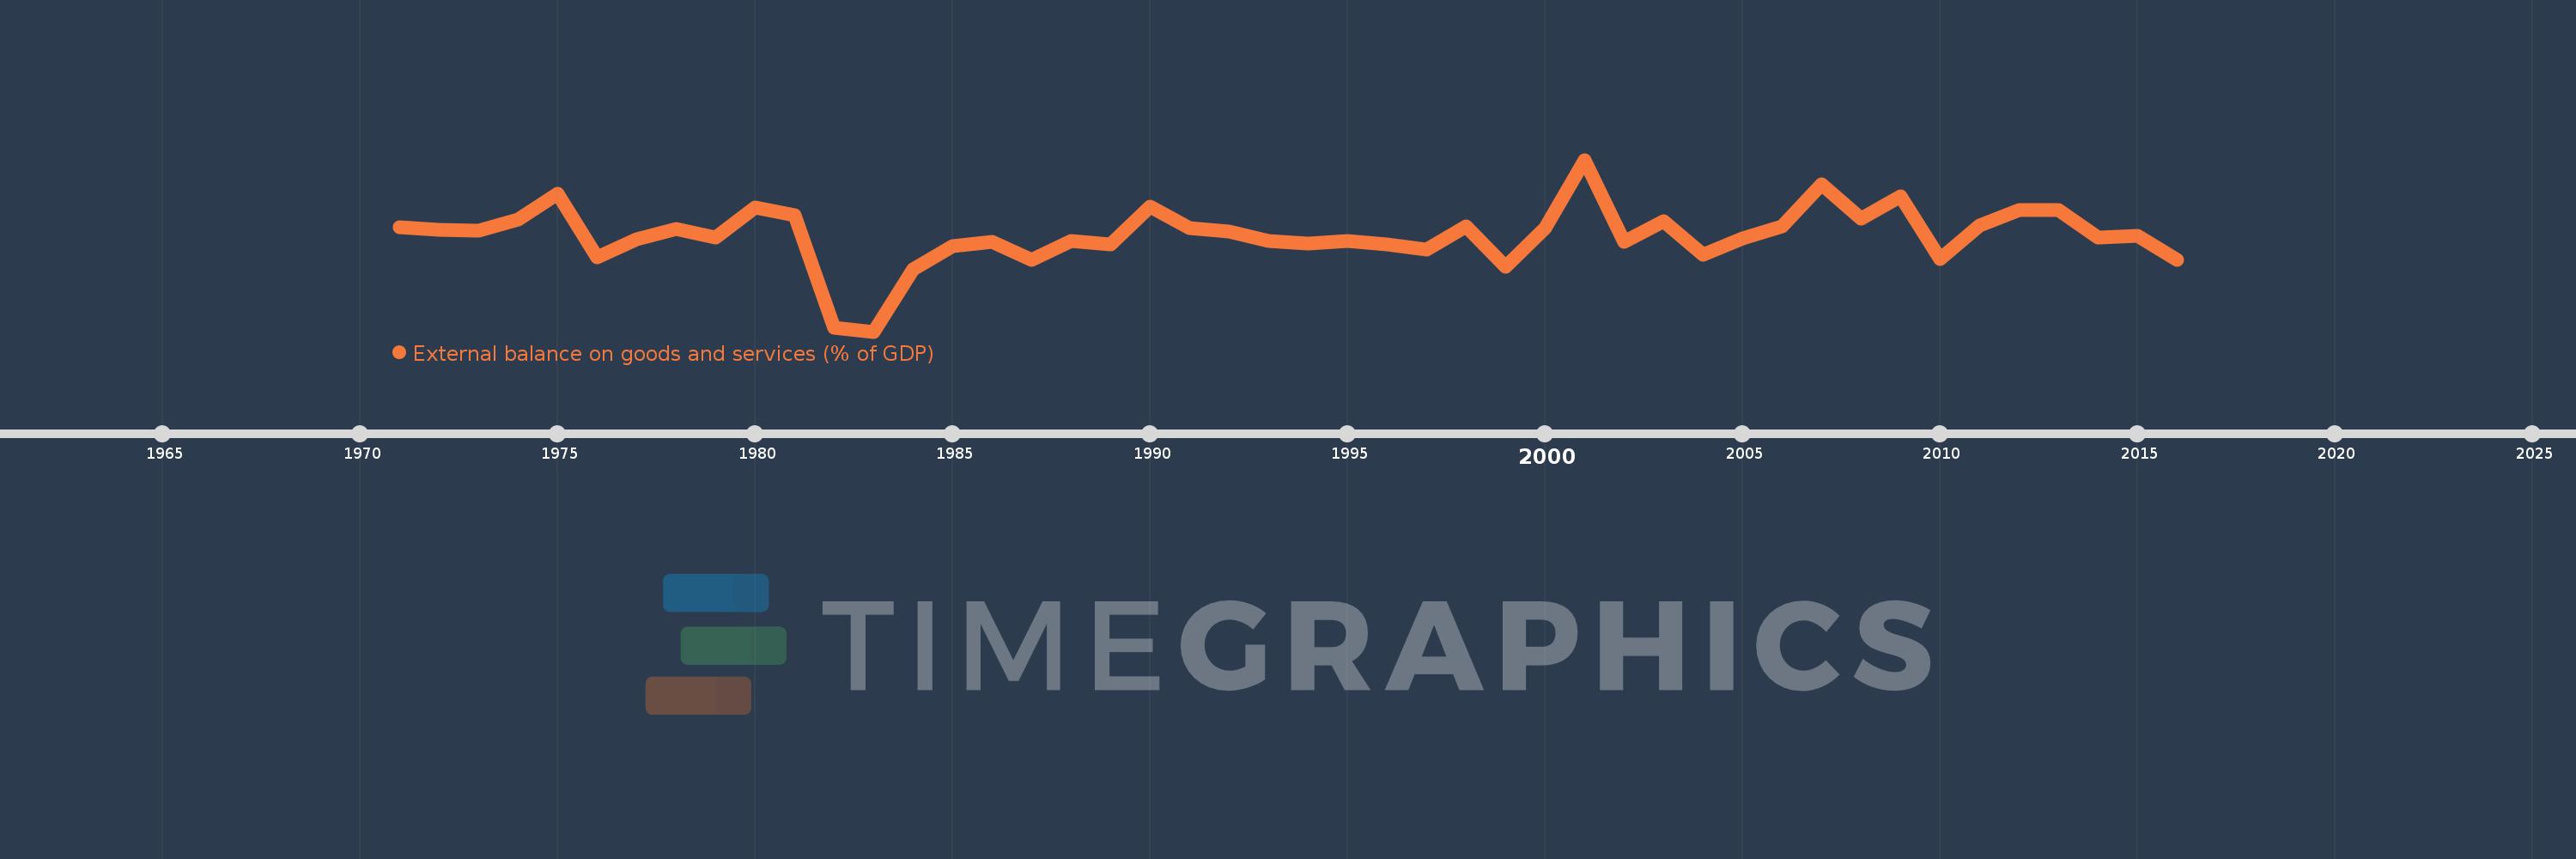
External balance on goods and services (% of GDP)
2016,2015,2014,2013,2012,2011,2010,2009,2008,2007,2006,2005,2004,2003,2002,2001,2000,1999,1998,1997,1996,1995,1994,1993,1992,1991,1990,1989,1988,1987,1986,1985,1984,1983,1982,1981,1980,1979,1978,1977,1976,1975,1974,1973,1972,1971
This statistics in other country:
AfghanistanAlbaniaAlgeriaAngolaAntigua and BarbudaArab WorldArgentinaArmeniaArubaAustraliaAustriaAzerbaijanBahamas, TheBahrainBangladeshBarbadosBelarusBelgiumBelizeBeninBermudaBhutanBoliviaBosnia and HerzegovinaBotswanaBrazilBrunei DarussalamBulgariaBurkina FasoBurundiCabo VerdeCambodiaCameroonCanadaCaribbean small statesCentral African RepublicCentral Europe and the BalticsChadChileChinaColombiaComorosCongo, Dem. Rep.Congo, Rep.Costa RicaCote d'IvoireCroatiaCubaCyprusCzech RepublicDenmarkDjiboutiDominicaDominican RepublicEarly-demographic dividendEast Asia & PacificEast Asia & Pacific (excluding high income)East Asia & Pacific (IDA & IBRD countries)EcuadorEgypt, Arab Rep.El SalvadorEquatorial GuineaEritreaEstoniaEthiopiaEuro areaEurope & Central AsiaEurope & Central Asia (excluding high income)Europe & Central Asia (IDA & IBRD countries)European UnionFaroe IslandsFijiFinlandFragile and conflict affected situationsFranceFrench PolynesiaGabonGambia, TheGeorgiaGermanyGhanaGreeceGrenadaGuatemalaGuineaGuinea-BissauGuyanaHaitiHeavily indebted poor countries (HIPC)High incomeHondurasHong Kong SAR, ChinaHungaryIBRD onlyIcelandIDA & IBRD totalIDA blendIDA onlyIDA totalIndiaIndonesiaIran, Islamic Rep.IraqIrelandIsraelItalyJamaicaJapanJordanKazakhstanKenyaKiribatiKorea, Rep.KosovoKuwaitKyrgyz RepublicLao PDRLate-demographic dividendLatin America & Caribbean Latin America & Caribbean (excluding high income)Latin America & the Caribbean (IDA & IBRD countries)LatviaLeast developed countries: UN classificationLebanonLesothoLiberiaLibyaLithuaniaLow & middle incomeLow incomeLower middle incomeLuxembourgMacao SAR, ChinaMacedonia, FYRMadagascarMalawiMalaysiaMaldivesMaliMaltaMauritaniaMauritiusMexicoMicronesia, Fed. Sts.Middle East & North AfricaMiddle East & North Africa (excluding high income)Middle East & North Africa (IDA & IBRD countries)Middle incomeMoldovaMongoliaMontenegroMoroccoMozambiqueMyanmarNamibiaNepalNetherlandsNew CaledoniaNew ZealandNicaraguaNigerNigeriaNorth AmericaNorwayOECD membersOmanOther small statesPacific island small statesPakistanPalauPanamaPapua New GuineaParaguayPeruPhilippinesPolandPortugalPost-demographic dividendPre-demographic dividendPuerto RicoQatarRomaniaRussian FederationRwandaSamoaSaudi ArabiaSenegalSerbiaSeychellesSierra LeoneSingaporeSlovak RepublicSloveniaSmall statesSolomon IslandsSomaliaSouth AfricaSouth AsiaSouth Asia (IDA & IBRD)South SudanSpainSri LankaSt. Kitts and NevisSt. LuciaSt. Vincent and the GrenadinesSub-Saharan Africa Sub-Saharan Africa (excluding high income)Sub-Saharan Africa (IDA & IBRD countries)SudanSurinameSwazilandSwedenSwitzerlandSyrian Arab RepublicTajikistanTanzaniaThailandTimor-LesteTogoTongaTrinidad and TobagoTunisiaTurkeyTurkmenistanUgandaUkraineUnited Arab EmiratesUnited KingdomUnited StatesUpper middle incomeUruguayUzbekistanVanuatuVenezuela, RBVietnamWest Bank and GazaWorldYemen, Rep.ZambiaZimbabwe Timeline:
This timeline shows a graph from 1971 to 2016 of Pre-demographic dividend. No data until 1970. Number of actual observations by date: 46.
Source name:
World Development Indicators
Source organization:
World Bank national accounts data, and OECD National Accounts data files.
Categories, topics:
Economy & Growth, Trade
Last updated:
apr 23, 2017
Indicators value changes by year
Minimum:
-15.685
jan 1, 1983
Maximum:
12.952
jan 1, 2001
At the date of observation
Value
Absolute change
Change from previous value
jan 1, 1971
1.736
+1.736
0.0%
jan 1, 1972
1.24
-0.496
-28.58%
jan 1, 1973
1.199
-0.041
-3.34%
jan 1, 1974
2.954
+1.756
146.47%
jan 1, 1975
7.296
+4.341
146.95%
jan 1, 1976
-3.23
-10.526
-144.28%
jan 1, 1977
-0.251
+2.979
-92.23%
jan 1, 1978
1.47
+1.721
-686.09%
jan 1, 1979
0.029
-1.441
-98.0%
jan 1, 1980
5.038
+5.008
17.05K%
jan 1, 1981
3.774
-1.263
-25.08%
jan 1, 1982
-15.057
-18.831
-498.91%
jan 1, 1983
-15.685
-0.628
4.17%
jan 1, 1984
-5.271
+10.414
-66.39%
jan 1, 1985
-1.418
+3.853
-73.1%
jan 1, 1986
-0.672
+0.745
-52.58%
jan 1, 1987
-3.688
-3.016
448.6%
jan 1, 1988
-0.588
+3.1
-84.07%
jan 1, 1989
-1.168
-0.581
98.8%
jan 1, 1990
5.116
+6.284
-537.9%
jan 1, 1991
1.567
-3.549
-69.38%
jan 1, 1992
0.933
-0.634
-40.45%
jan 1, 1993
-0.62
-1.553
-166.5%
jan 1, 1994
-0.975
-0.355
57.15%
jan 1, 1995
-0.53
+0.445
-45.64%
jan 1, 1996
-1.191
-0.661
124.62%
jan 1, 1997
-1.957
-0.767
64.41%
jan 1, 1998
1.898
+3.855
-196.97%
jan 1, 1999
-4.871
-6.77
-356.65%
jan 1, 2000
1.548
+6.419
-131.77%
jan 1, 2001
12.952
+11.404
736.79%
jan 1, 2002
-0.665
-13.617
-105.13%
jan 1, 2003
2.736
+3.401
-511.57%
jan 1, 2004
-2.858
-5.595
-204.45%
jan 1, 2005
-0.118
+2.74
-95.86%
jan 1, 2006
1.909
+2.028
-1.71K%
jan 1, 2007
8.869
+6.959
364.49%
jan 1, 2008
3.215
-5.654
-63.75%
jan 1, 2009
6.796
+3.582
111.41%
jan 1, 2010
-3.625
-10.421
-153.34%
jan 1, 2011
2.046
+5.671
-156.44%
jan 1, 2012
4.51
+2.464
120.44%
jan 1, 2013
4.532
+0.022
0.49%
jan 1, 2014
-0.003
-4.535
-100.07%
jan 1, 2015
0.322
+0.325
-11.01K%
jan 1, 2016
-3.669
-3.991
-1.24K%
Ranking of countries by current statistics by years


Comments: