29
/
en
AIzaSyAYiBZKx7MnpbEhh9jyipgxe19OcubqV5w
April 1, 2024
110871
Congo, Rep.
COG
true
2
1
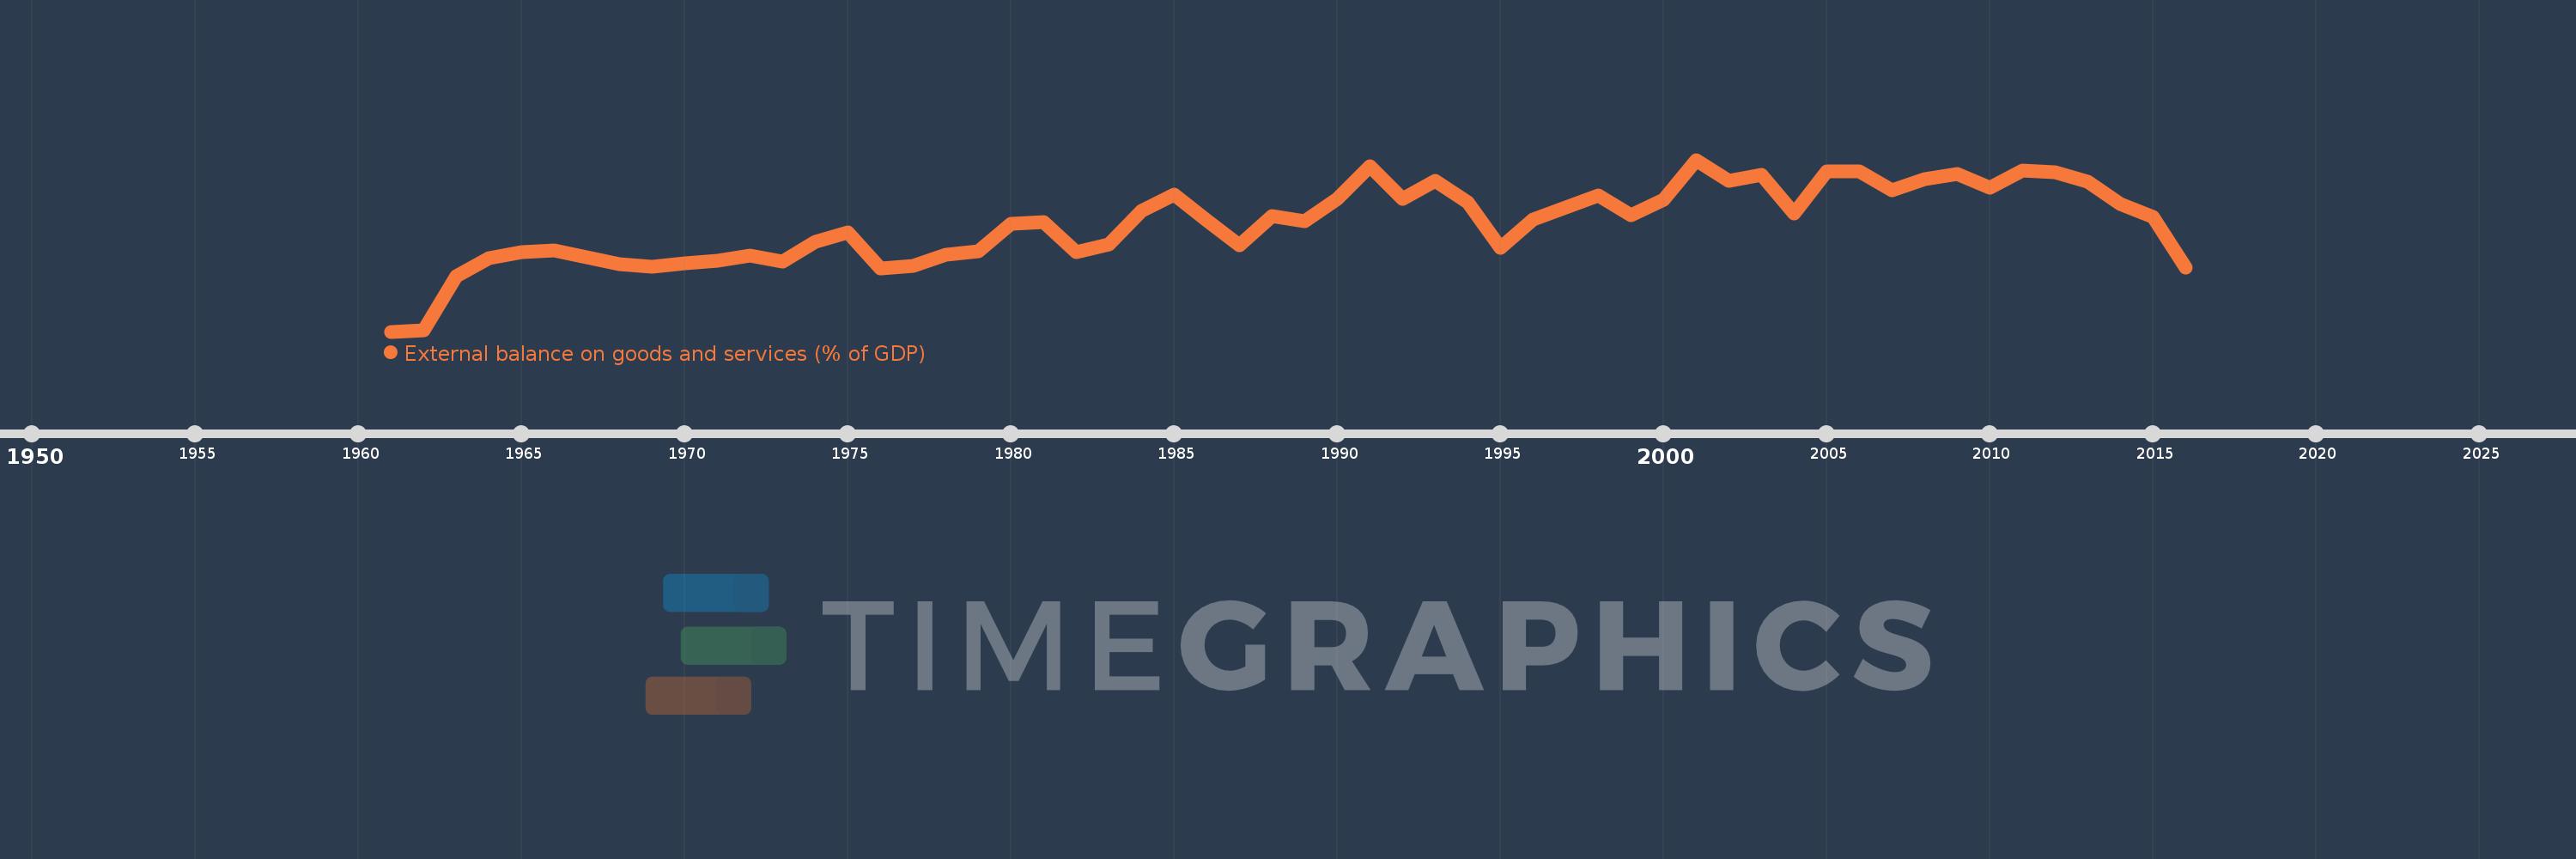
External balance on goods and services (% of GDP)
2016,2015,2014,2013,2012,2011,2010,2009,2008,2007,2006,2005,2004,2003,2002,2001,2000,1999,1998,1997,1996,1995,1994,1993,1992,1991,1990,1989,1988,1987,1986,1985,1984,1983,1982,1981,1980,1979,1978,1977,1976,1975,1974,1973,1972,1971,1970,1969,1968,1967,1966,1965,1964,1963,1962,1961
This statistics in other country:
AfghanistanAlbaniaAlgeriaAngolaAntigua and BarbudaArab WorldArgentinaArmeniaArubaAustraliaAustriaAzerbaijanBahamas, TheBahrainBangladeshBarbadosBelarusBelgiumBelizeBeninBermudaBhutanBoliviaBosnia and HerzegovinaBotswanaBrazilBrunei DarussalamBulgariaBurkina FasoBurundiCabo VerdeCambodiaCameroonCanadaCaribbean small statesCentral African RepublicCentral Europe and the BalticsChadChileChinaColombiaComorosCongo, Dem. Rep.Congo, Rep.Costa RicaCote d'IvoireCroatiaCubaCyprusCzech RepublicDenmarkDjiboutiDominicaDominican RepublicEarly-demographic dividendEast Asia & PacificEast Asia & Pacific (excluding high income)East Asia & Pacific (IDA & IBRD countries)EcuadorEgypt, Arab Rep.El SalvadorEquatorial GuineaEritreaEstoniaEthiopiaEuro areaEurope & Central AsiaEurope & Central Asia (excluding high income)Europe & Central Asia (IDA & IBRD countries)European UnionFaroe IslandsFijiFinlandFragile and conflict affected situationsFranceFrench PolynesiaGabonGambia, TheGeorgiaGermanyGhanaGreeceGrenadaGuatemalaGuineaGuinea-BissauGuyanaHaitiHeavily indebted poor countries (HIPC)High incomeHondurasHong Kong SAR, ChinaHungaryIBRD onlyIcelandIDA & IBRD totalIDA blendIDA onlyIDA totalIndiaIndonesiaIran, Islamic Rep.IraqIrelandIsraelItalyJamaicaJapanJordanKazakhstanKenyaKiribatiKorea, Rep.KosovoKuwaitKyrgyz RepublicLao PDRLate-demographic dividendLatin America & Caribbean Latin America & Caribbean (excluding high income)Latin America & the Caribbean (IDA & IBRD countries)LatviaLeast developed countries: UN classificationLebanonLesothoLiberiaLibyaLithuaniaLow & middle incomeLow incomeLower middle incomeLuxembourgMacao SAR, ChinaMacedonia, FYRMadagascarMalawiMalaysiaMaldivesMaliMaltaMauritaniaMauritiusMexicoMicronesia, Fed. Sts.Middle East & North AfricaMiddle East & North Africa (excluding high income)Middle East & North Africa (IDA & IBRD countries)Middle incomeMoldovaMongoliaMontenegroMoroccoMozambiqueMyanmarNamibiaNepalNetherlandsNew CaledoniaNew ZealandNicaraguaNigerNigeriaNorth AmericaNorwayOECD membersOmanOther small statesPacific island small statesPakistanPalauPanamaPapua New GuineaParaguayPeruPhilippinesPolandPortugalPost-demographic dividendPre-demographic dividendPuerto RicoQatarRomaniaRussian FederationRwandaSamoaSaudi ArabiaSenegalSerbiaSeychellesSierra LeoneSingaporeSlovak RepublicSloveniaSmall statesSolomon IslandsSomaliaSouth AfricaSouth AsiaSouth Asia (IDA & IBRD)South SudanSpainSri LankaSt. Kitts and NevisSt. LuciaSt. Vincent and the GrenadinesSub-Saharan Africa Sub-Saharan Africa (excluding high income)Sub-Saharan Africa (IDA & IBRD countries)SudanSurinameSwazilandSwedenSwitzerlandSyrian Arab RepublicTajikistanTanzaniaThailandTimor-LesteTogoTongaTrinidad and TobagoTunisiaTurkeyTurkmenistanUgandaUkraineUnited Arab EmiratesUnited KingdomUnited StatesUpper middle incomeUruguayUzbekistanVanuatuVenezuela, RBVietnamWest Bank and GazaWorldYemen, Rep.ZambiaZimbabwe Timeline:
This timeline shows a graph from 1961 to 2016 of Congo, Rep.. No data until 1960. Number of actual observations by date: 56.
Source name:
World Development Indicators
Source organization:
World Bank national accounts data, and OECD National Accounts data files.
Categories, topics:
Economy & Growth, Trade
Last updated:
apr 23, 2017
Indicators value changes by year
Minimum:
-65.154
jan 1, 1961
Maximum:
36.684
jan 1, 2001
At the date of observation
Value
Absolute change
Change from previous value
jan 1, 1961
-65.154
-65.154
0.0%
jan 1, 1962
-64.202
+0.952
-1.46%
jan 1, 1963
-32.462
+31.74
-49.44%
jan 1, 1964
-21.375
+11.087
-34.16%
jan 1, 1965
-18.296
+3.078
-14.4%
jan 1, 1966
-17.078
+1.218
-6.66%
jan 1, 1967
-21.218
-4.14
24.24%
jan 1, 1968
-25.342
-4.125
19.44%
jan 1, 1969
-26.849
-1.506
5.94%
jan 1, 1970
-24.819
+2.03
-7.56%
jan 1, 1971
-23.026
+1.792
-7.22%
jan 1, 1972
-20.068
+2.959
-12.85%
jan 1, 1973
-23.478
-3.411
17.0%
jan 1, 1974
-11.755
+11.723
-49.93%
jan 1, 1975
-6.246
+5.509
-46.87%
jan 1, 1976
-27.859
-21.613
346.06%
jan 1, 1977
-26.179
+1.68
-6.03%
jan 1, 1978
-19.681
+6.498
-24.82%
jan 1, 1979
-17.348
+2.333
-11.86%
jan 1, 1980
-1.216
+16.132
-92.99%
jan 1, 1981
-0.111
+1.105
-90.87%
jan 1, 1982
-18.073
-17.962
16.18K%
jan 1, 1983
-13.239
+4.833
-26.74%
jan 1, 1984
6.181
+19.421
-146.69%
jan 1, 1985
16.004
+9.823
158.92%
jan 1, 1986
0.783
-15.221
-95.11%
jan 1, 1987
-13.835
-14.618
-1.87K%
jan 1, 1988
3.113
+16.948
-122.5%
jan 1, 1989
0.197
-2.916
-93.66%
jan 1, 1990
13.695
+13.498
6.84K%
jan 1, 1991
32.735
+19.04
139.02%
jan 1, 1992
13.585
-19.151
-58.5%
jan 1, 1993
24.243
+10.659
78.46%
jan 1, 1994
11.497
-12.747
-52.58%
jan 1, 1995
-15.702
-27.199
-236.58%
jan 1, 1996
1.097
+16.799
-106.98%
jan 1, 1997
8.509
+7.412
675.9%
jan 1, 1998
15.435
+6.926
81.4%
jan 1, 1999
3.654
-11.782
-76.33%
jan 1, 2000
13.186
+9.532
260.9%
jan 1, 2001
36.684
+23.498
178.21%
jan 1, 2002
24.108
-12.577
-34.28%
jan 1, 2003
27.577
+3.469
14.39%
jan 1, 2004
4.763
-22.814
-82.73%
jan 1, 2005
29.691
+24.928
523.38%
jan 1, 2006
29.653
-0.039
-0.13%
jan 1, 2007
18.54
-11.113
-37.48%
jan 1, 2008
25.006
+6.467
34.88%
jan 1, 2009
28.149
+3.143
12.57%
jan 1, 2010
20.213
-7.936
-28.19%
jan 1, 2011
30.422
+10.209
50.51%
jan 1, 2012
29.447
-0.974
-3.2%
jan 1, 2013
23.446
-6.001
-20.38%
jan 1, 2014
10.46
-12.985
-55.38%
jan 1, 2015
2.734
-7.726
-73.86%
jan 1, 2016
-27.095
-29.829
-1.09K%
Ranking of countries by current statistics by years


Comments: