29
/
en
AIzaSyAYiBZKx7MnpbEhh9jyipgxe19OcubqV5w
April 1, 2024
99854
Cameroon
CMR
true
2
1
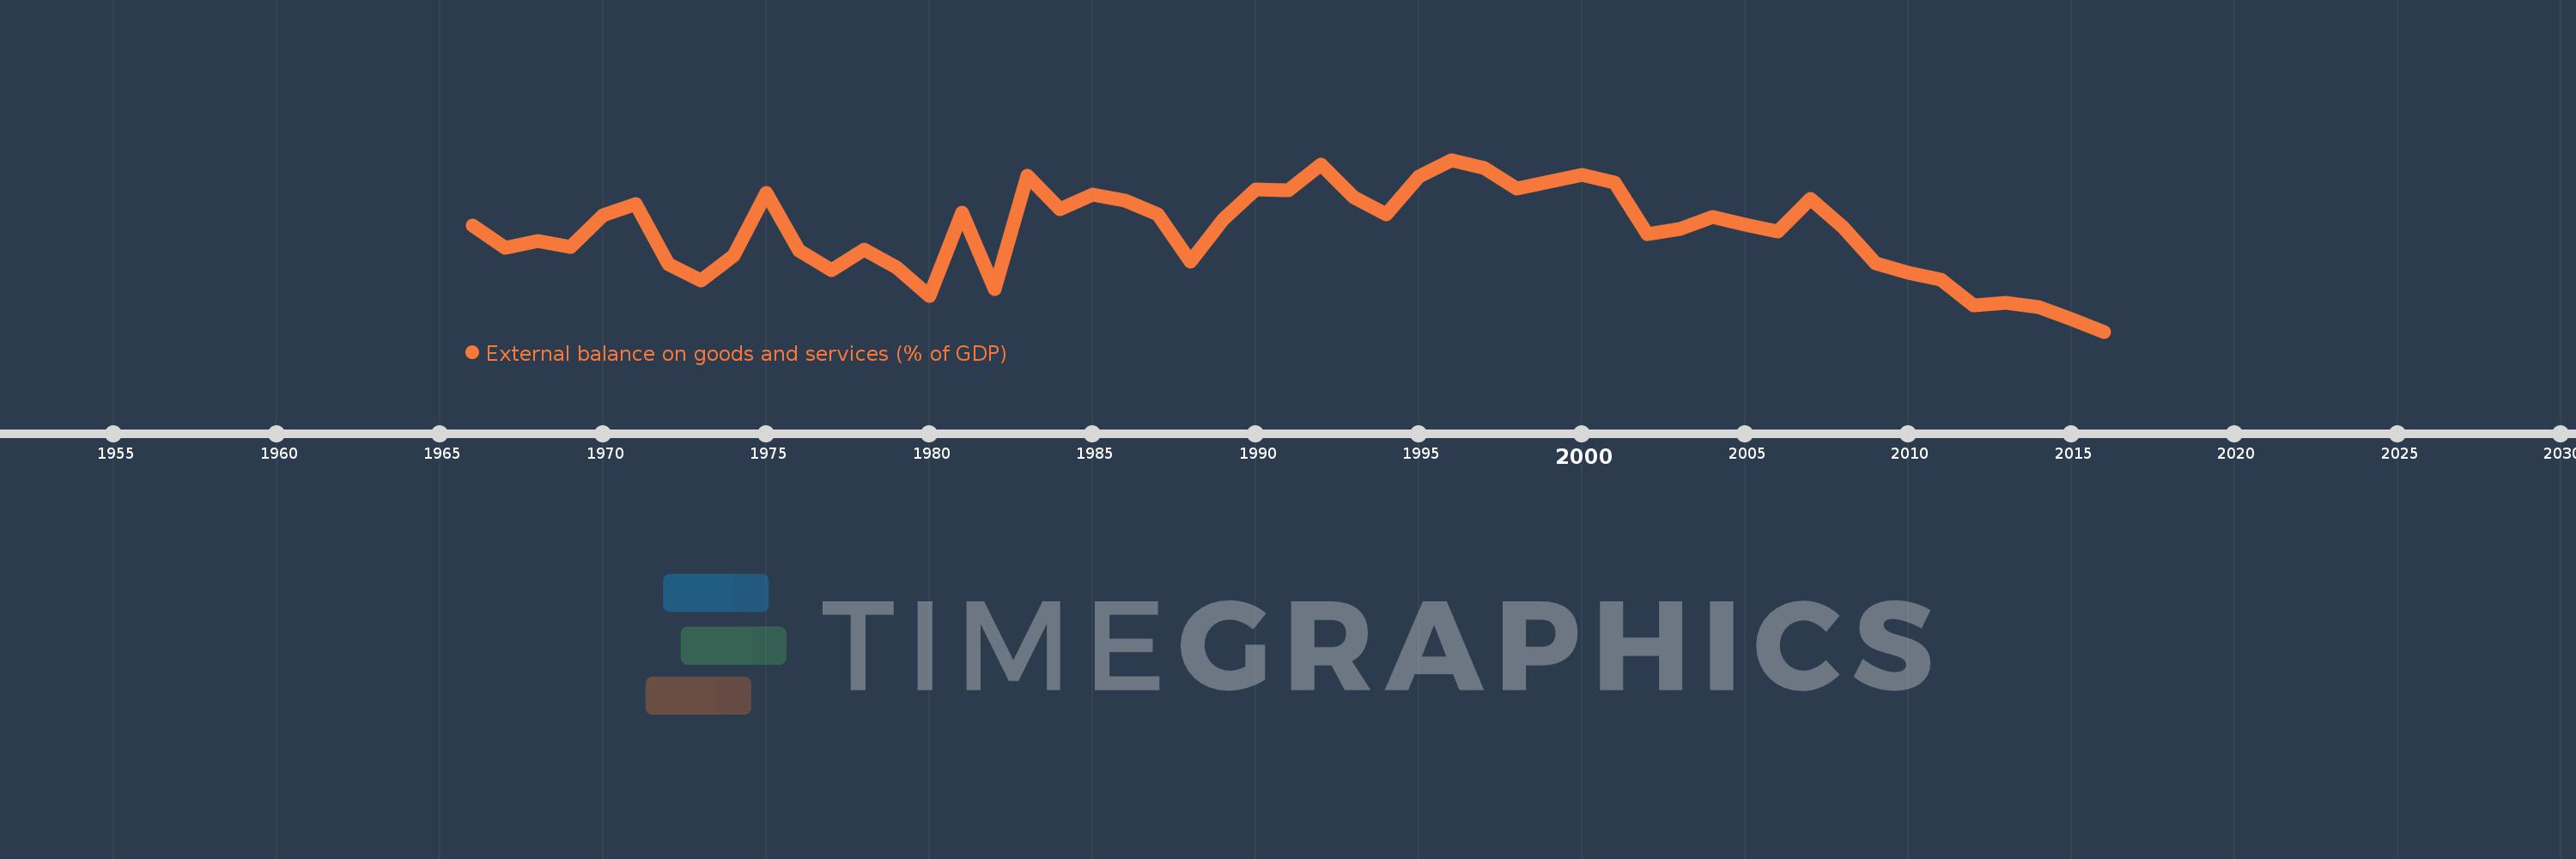
External balance on goods and services (% of GDP)
2016,2015,2014,2013,2012,2011,2010,2009,2008,2007,2006,2005,2004,2003,2002,2001,2000,1999,1998,1997,1996,1995,1994,1993,1992,1991,1990,1989,1988,1987,1986,1985,1984,1983,1982,1981,1980,1979,1978,1977,1976,1975,1974,1973,1972,1971,1970,1969,1968,1967,1966
This statistics in other country:
AfghanistanAlbaniaAlgeriaAngolaAntigua and BarbudaArab WorldArgentinaArmeniaArubaAustraliaAustriaAzerbaijanBahamas, TheBahrainBangladeshBarbadosBelarusBelgiumBelizeBeninBermudaBhutanBoliviaBosnia and HerzegovinaBotswanaBrazilBrunei DarussalamBulgariaBurkina FasoBurundiCabo VerdeCambodiaCameroonCanadaCaribbean small statesCentral African RepublicCentral Europe and the BalticsChadChileChinaColombiaComorosCongo, Dem. Rep.Congo, Rep.Costa RicaCote d'IvoireCroatiaCubaCyprusCzech RepublicDenmarkDjiboutiDominicaDominican RepublicEarly-demographic dividendEast Asia & PacificEast Asia & Pacific (excluding high income)East Asia & Pacific (IDA & IBRD countries)EcuadorEgypt, Arab Rep.El SalvadorEquatorial GuineaEritreaEstoniaEthiopiaEuro areaEurope & Central AsiaEurope & Central Asia (excluding high income)Europe & Central Asia (IDA & IBRD countries)European UnionFaroe IslandsFijiFinlandFragile and conflict affected situationsFranceFrench PolynesiaGabonGambia, TheGeorgiaGermanyGhanaGreeceGrenadaGuatemalaGuineaGuinea-BissauGuyanaHaitiHeavily indebted poor countries (HIPC)High incomeHondurasHong Kong SAR, ChinaHungaryIBRD onlyIcelandIDA & IBRD totalIDA blendIDA onlyIDA totalIndiaIndonesiaIran, Islamic Rep.IraqIrelandIsraelItalyJamaicaJapanJordanKazakhstanKenyaKiribatiKorea, Rep.KosovoKuwaitKyrgyz RepublicLao PDRLate-demographic dividendLatin America & Caribbean Latin America & Caribbean (excluding high income)Latin America & the Caribbean (IDA & IBRD countries)LatviaLeast developed countries: UN classificationLebanonLesothoLiberiaLibyaLithuaniaLow & middle incomeLow incomeLower middle incomeLuxembourgMacao SAR, ChinaMacedonia, FYRMadagascarMalawiMalaysiaMaldivesMaliMaltaMauritaniaMauritiusMexicoMicronesia, Fed. Sts.Middle East & North AfricaMiddle East & North Africa (excluding high income)Middle East & North Africa (IDA & IBRD countries)Middle incomeMoldovaMongoliaMontenegroMoroccoMozambiqueMyanmarNamibiaNepalNetherlandsNew CaledoniaNew ZealandNicaraguaNigerNigeriaNorth AmericaNorwayOECD membersOmanOther small statesPacific island small statesPakistanPalauPanamaPapua New GuineaParaguayPeruPhilippinesPolandPortugalPost-demographic dividendPre-demographic dividendPuerto RicoQatarRomaniaRussian FederationRwandaSamoaSaudi ArabiaSenegalSerbiaSeychellesSierra LeoneSingaporeSlovak RepublicSloveniaSmall statesSolomon IslandsSomaliaSouth AfricaSouth AsiaSouth Asia (IDA & IBRD)South SudanSpainSri LankaSt. Kitts and NevisSt. LuciaSt. Vincent and the GrenadinesSub-Saharan Africa Sub-Saharan Africa (excluding high income)Sub-Saharan Africa (IDA & IBRD countries)SudanSurinameSwazilandSwedenSwitzerlandSyrian Arab RepublicTajikistanTanzaniaThailandTimor-LesteTogoTongaTrinidad and TobagoTunisiaTurkeyTurkmenistanUgandaUkraineUnited Arab EmiratesUnited KingdomUnited StatesUpper middle incomeUruguayUzbekistanVanuatuVenezuela, RBVietnamWest Bank and GazaWorldYemen, Rep.ZambiaZimbabwe Timeline:
This timeline shows a graph from 1966 to 2016 of Cameroon. No data until 1965. Number of actual observations by date: 51.
Source name:
World Development Indicators
Source organization:
World Bank national accounts data, and OECD National Accounts data files.
Categories, topics:
Economy & Growth, Trade
Last updated:
apr 23, 2017
Indicators value changes by year
Minimum:
-10.573
jan 1, 2016
At the date of observation
Value
Absolute change
Change from previous value
jan 1, 1966
-0.501
-0.501
0.0%
jan 1, 1967
-2.583
-2.081
415.21%
jan 1, 1968
-1.954
+0.629
-24.34%
jan 1, 1969
-2.51
-0.556
28.44%
jan 1, 1970
0.524
+3.034
-120.89%
jan 1, 1971
1.54
+1.016
193.71%
jan 1, 1972
-4.14
-5.68
-368.83%
jan 1, 1973
-5.694
-1.554
37.54%
jan 1, 1974
-3.303
+2.39
-41.98%
jan 1, 1975
2.638
+5.942
-179.86%
jan 1, 1976
-2.858
-5.496
-208.34%
jan 1, 1977
-4.722
-1.864
65.22%
jan 1, 1978
-2.746
+1.976
-41.85%
jan 1, 1979
-4.467
-1.721
62.68%
jan 1, 1980
-7.164
-2.697
60.38%
jan 1, 1981
0.753
+7.917
-110.52%
jan 1, 1982
-6.547
-7.3
-969.05%
jan 1, 1983
4.303
+10.85
-165.73%
jan 1, 1984
1.094
-3.209
-74.58%
jan 1, 1985
2.485
+1.391
127.16%
jan 1, 1986
1.873
-0.612
-24.63%
jan 1, 1987
0.557
-1.316
-70.26%
jan 1, 1988
-3.932
-4.489
-805.97%
jan 1, 1989
0.071
+4.003
-101.81%
jan 1, 1990
2.938
+2.866
4.02K%
jan 1, 1991
2.869
-0.068
-2.32%
jan 1, 1992
5.359
+2.49
86.76%
jan 1, 1993
2.231
-3.128
-58.36%
jan 1, 1994
0.614
-1.617
-72.47%
jan 1, 1995
4.217
+3.603
586.6%
jan 1, 1996
5.781
+1.564
37.08%
jan 1, 1997
4.99
-0.792
-13.69%
jan 1, 1998
3.068
-1.922
-38.51%
jan 1, 1999
3.724
+0.656
21.37%
jan 1, 2000
4.338
+0.614
16.49%
jan 1, 2001
3.591
-0.747
-17.21%
jan 1, 2002
-1.294
-4.886
-136.04%
jan 1, 2003
-0.783
+0.511
-39.49%
jan 1, 2004
0.327
+1.11
-141.78%
jan 1, 2005
-0.43
-0.757
-231.47%
jan 1, 2006
-1.016
-0.586
136.29%
jan 1, 2007
2.051
+3.068
-301.79%
jan 1, 2008
-0.675
-2.726
-132.91%
jan 1, 2009
-4.082
-3.407
504.62%
jan 1, 2010
-4.992
-0.91
22.3%
jan 1, 2011
-5.666
-0.674
13.5%
jan 1, 2012
-8.085
-2.419
42.69%
jan 1, 2013
-7.812
+0.273
-3.37%
jan 1, 2014
-8.252
-0.44
5.63%
jan 1, 2015
-9.416
-1.164
14.1%
jan 1, 2016
-10.573
-1.158
12.29%
Ranking of countries by current statistics by years


Comments: