29
/
en
AIzaSyAYiBZKx7MnpbEhh9jyipgxe19OcubqV5w
April 1, 2024
103545
Chad
TCD
true
2
1
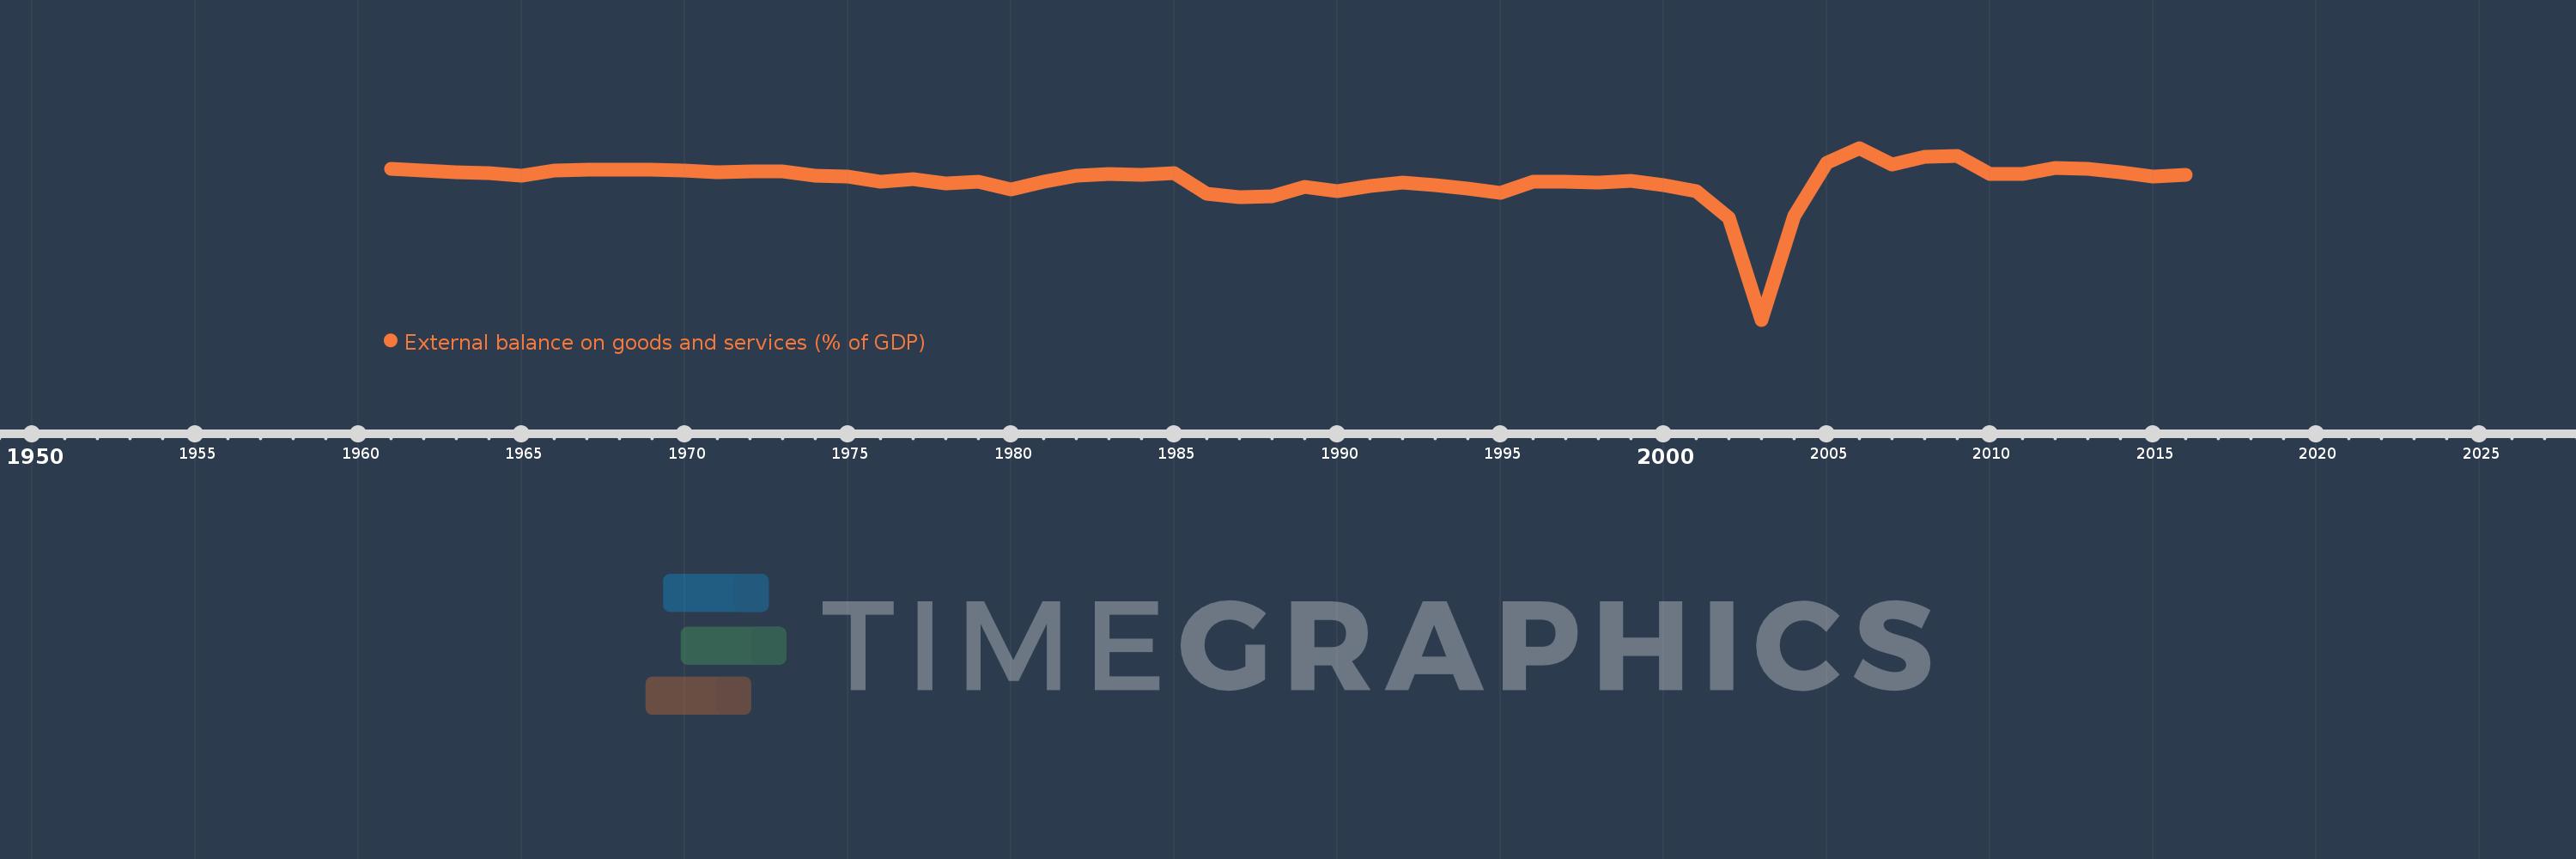
External balance on goods and services (% of GDP)
2016,2015,2014,2013,2012,2011,2010,2009,2008,2007,2006,2005,2004,2003,2002,2001,2000,1999,1998,1997,1996,1995,1994,1993,1992,1991,1990,1989,1988,1987,1986,1985,1984,1983,1982,1981,1980,1979,1978,1977,1976,1975,1974,1973,1972,1971,1970,1969,1968,1967,1966,1965,1964,1963,1962,1961
This statistics in other country:
AfghanistanAlbaniaAlgeriaAngolaAntigua and BarbudaArab WorldArgentinaArmeniaArubaAustraliaAustriaAzerbaijanBahamas, TheBahrainBangladeshBarbadosBelarusBelgiumBelizeBeninBermudaBhutanBoliviaBosnia and HerzegovinaBotswanaBrazilBrunei DarussalamBulgariaBurkina FasoBurundiCabo VerdeCambodiaCameroonCanadaCaribbean small statesCentral African RepublicCentral Europe and the BalticsChadChileChinaColombiaComorosCongo, Dem. Rep.Congo, Rep.Costa RicaCote d'IvoireCroatiaCubaCyprusCzech RepublicDenmarkDjiboutiDominicaDominican RepublicEarly-demographic dividendEast Asia & PacificEast Asia & Pacific (excluding high income)East Asia & Pacific (IDA & IBRD countries)EcuadorEgypt, Arab Rep.El SalvadorEquatorial GuineaEritreaEstoniaEthiopiaEuro areaEurope & Central AsiaEurope & Central Asia (excluding high income)Europe & Central Asia (IDA & IBRD countries)European UnionFaroe IslandsFijiFinlandFragile and conflict affected situationsFranceFrench PolynesiaGabonGambia, TheGeorgiaGermanyGhanaGreeceGrenadaGuatemalaGuineaGuinea-BissauGuyanaHaitiHeavily indebted poor countries (HIPC)High incomeHondurasHong Kong SAR, ChinaHungaryIBRD onlyIcelandIDA & IBRD totalIDA blendIDA onlyIDA totalIndiaIndonesiaIran, Islamic Rep.IraqIrelandIsraelItalyJamaicaJapanJordanKazakhstanKenyaKiribatiKorea, Rep.KosovoKuwaitKyrgyz RepublicLao PDRLate-demographic dividendLatin America & Caribbean Latin America & Caribbean (excluding high income)Latin America & the Caribbean (IDA & IBRD countries)LatviaLeast developed countries: UN classificationLebanonLesothoLiberiaLibyaLithuaniaLow & middle incomeLow incomeLower middle incomeLuxembourgMacao SAR, ChinaMacedonia, FYRMadagascarMalawiMalaysiaMaldivesMaliMaltaMauritaniaMauritiusMexicoMicronesia, Fed. Sts.Middle East & North AfricaMiddle East & North Africa (excluding high income)Middle East & North Africa (IDA & IBRD countries)Middle incomeMoldovaMongoliaMontenegroMoroccoMozambiqueMyanmarNamibiaNepalNetherlandsNew CaledoniaNew ZealandNicaraguaNigerNigeriaNorth AmericaNorwayOECD membersOmanOther small statesPacific island small statesPakistanPalauPanamaPapua New GuineaParaguayPeruPhilippinesPolandPortugalPost-demographic dividendPre-demographic dividendPuerto RicoQatarRomaniaRussian FederationRwandaSamoaSaudi ArabiaSenegalSerbiaSeychellesSierra LeoneSingaporeSlovak RepublicSloveniaSmall statesSolomon IslandsSomaliaSouth AfricaSouth AsiaSouth Asia (IDA & IBRD)South SudanSpainSri LankaSt. Kitts and NevisSt. LuciaSt. Vincent and the GrenadinesSub-Saharan Africa Sub-Saharan Africa (excluding high income)Sub-Saharan Africa (IDA & IBRD countries)SudanSurinameSwazilandSwedenSwitzerlandSyrian Arab RepublicTajikistanTanzaniaThailandTimor-LesteTogoTongaTrinidad and TobagoTunisiaTurkeyTurkmenistanUgandaUkraineUnited Arab EmiratesUnited KingdomUnited StatesUpper middle incomeUruguayUzbekistanVanuatuVenezuela, RBVietnamWest Bank and GazaWorldYemen, Rep.ZambiaZimbabwe Timeline:
This timeline shows a graph from 1961 to 2016 of Chad. No data until 1960. Number of actual observations by date: 56.
Source name:
World Development Indicators
Source organization:
World Bank national accounts data, and OECD National Accounts data files.
Categories, topics:
Economy & Growth, Trade
Last updated:
apr 23, 2017
Indicators value changes by year
Minimum:
-100.971
jan 1, 2003
Maximum:
10.108
jan 1, 2006
At the date of observation
Value
Absolute change
Change from previous value
jan 1, 1961
-3.648
-3.648
0.0%
jan 1, 1962
-4.646
-0.998
27.35%
jan 1, 1963
-5.599
-0.953
20.51%
jan 1, 1964
-6.264
-0.665
11.88%
jan 1, 1965
-7.602
-1.338
21.36%
jan 1, 1966
-4.313
+3.289
-43.27%
jan 1, 1967
-4.051
+0.262
-6.08%
jan 1, 1968
-3.802
+0.248
-6.13%
jan 1, 1969
-3.744
+0.058
-1.53%
jan 1, 1970
-4.492
-0.748
19.98%
jan 1, 1971
-5.79
-1.298
28.89%
jan 1, 1972
-5.145
+0.645
-11.13%
jan 1, 1973
-4.819
+0.326
-6.34%
jan 1, 1974
-7.771
-2.953
61.27%
jan 1, 1975
-8.413
-0.641
8.25%
jan 1, 1976
-11.448
-3.035
36.08%
jan 1, 1977
-10.3
+1.148
-10.02%
jan 1, 1978
-13.019
-2.718
26.39%
jan 1, 1979
-11.545
+1.474
-11.32%
jan 1, 1980
-16.859
-5.314
46.03%
jan 1, 1981
-11.921
+4.938
-29.29%
jan 1, 1982
-7.561
+4.36
-36.57%
jan 1, 1983
-6.933
+0.628
-8.31%
jan 1, 1984
-7.123
-0.19
2.74%
jan 1, 1985
-6.035
+1.087
-15.27%
jan 1, 1986
-19.42
-13.385
221.78%
jan 1, 1987
-21.982
-2.561
13.19%
jan 1, 1988
-20.983
+0.998
-4.54%
jan 1, 1989
-15.085
+5.898
-28.11%
jan 1, 1990
-17.627
-2.542
16.85%
jan 1, 1991
-14.427
+3.201
-18.16%
jan 1, 1992
-12.446
+1.98
-13.73%
jan 1, 1993
-13.723
-1.277
10.26%
jan 1, 1994
-16.0
-2.277
16.6%
jan 1, 1995
-18.777
-2.777
17.35%
jan 1, 1996
-11.839
+6.939
-36.95%
jan 1, 1997
-11.523
+0.316
-2.67%
jan 1, 1998
-12.225
-0.702
6.1%
jan 1, 1999
-11.076
+1.15
-9.4%
jan 1, 2000
-13.872
-2.796
25.24%
jan 1, 2001
-17.791
-3.919
28.25%
jan 1, 2002
-34.99
-17.199
96.67%
jan 1, 2003
-100.971
-65.981
188.57%
jan 1, 2004
-34.113
+66.858
-66.22%
jan 1, 2005
0.249
+34.362
-100.73%
jan 1, 2006
10.108
+9.859
3.96K%
jan 1, 2007
-0.744
-10.852
-107.36%
jan 1, 2008
4.276
+5.02
-674.46%
jan 1, 2009
5.099
+0.823
19.26%
jan 1, 2010
-6.833
-11.932
-233.99%
jan 1, 2011
-6.699
+0.133
-1.95%
jan 1, 2012
-2.927
+3.773
-56.32%
jan 1, 2013
-3.64
-0.713
24.36%
jan 1, 2014
-5.518
-1.878
51.61%
jan 1, 2015
-8.304
-2.786
50.49%
jan 1, 2016
-7.486
+0.818
-9.85%
Ranking of countries by current statistics by years


Comments: