29
/
en
AIzaSyAYiBZKx7MnpbEhh9jyipgxe19OcubqV5w
April 1, 2024
58050
South Asia (IDA & IBRD)
TSA
false
2
1
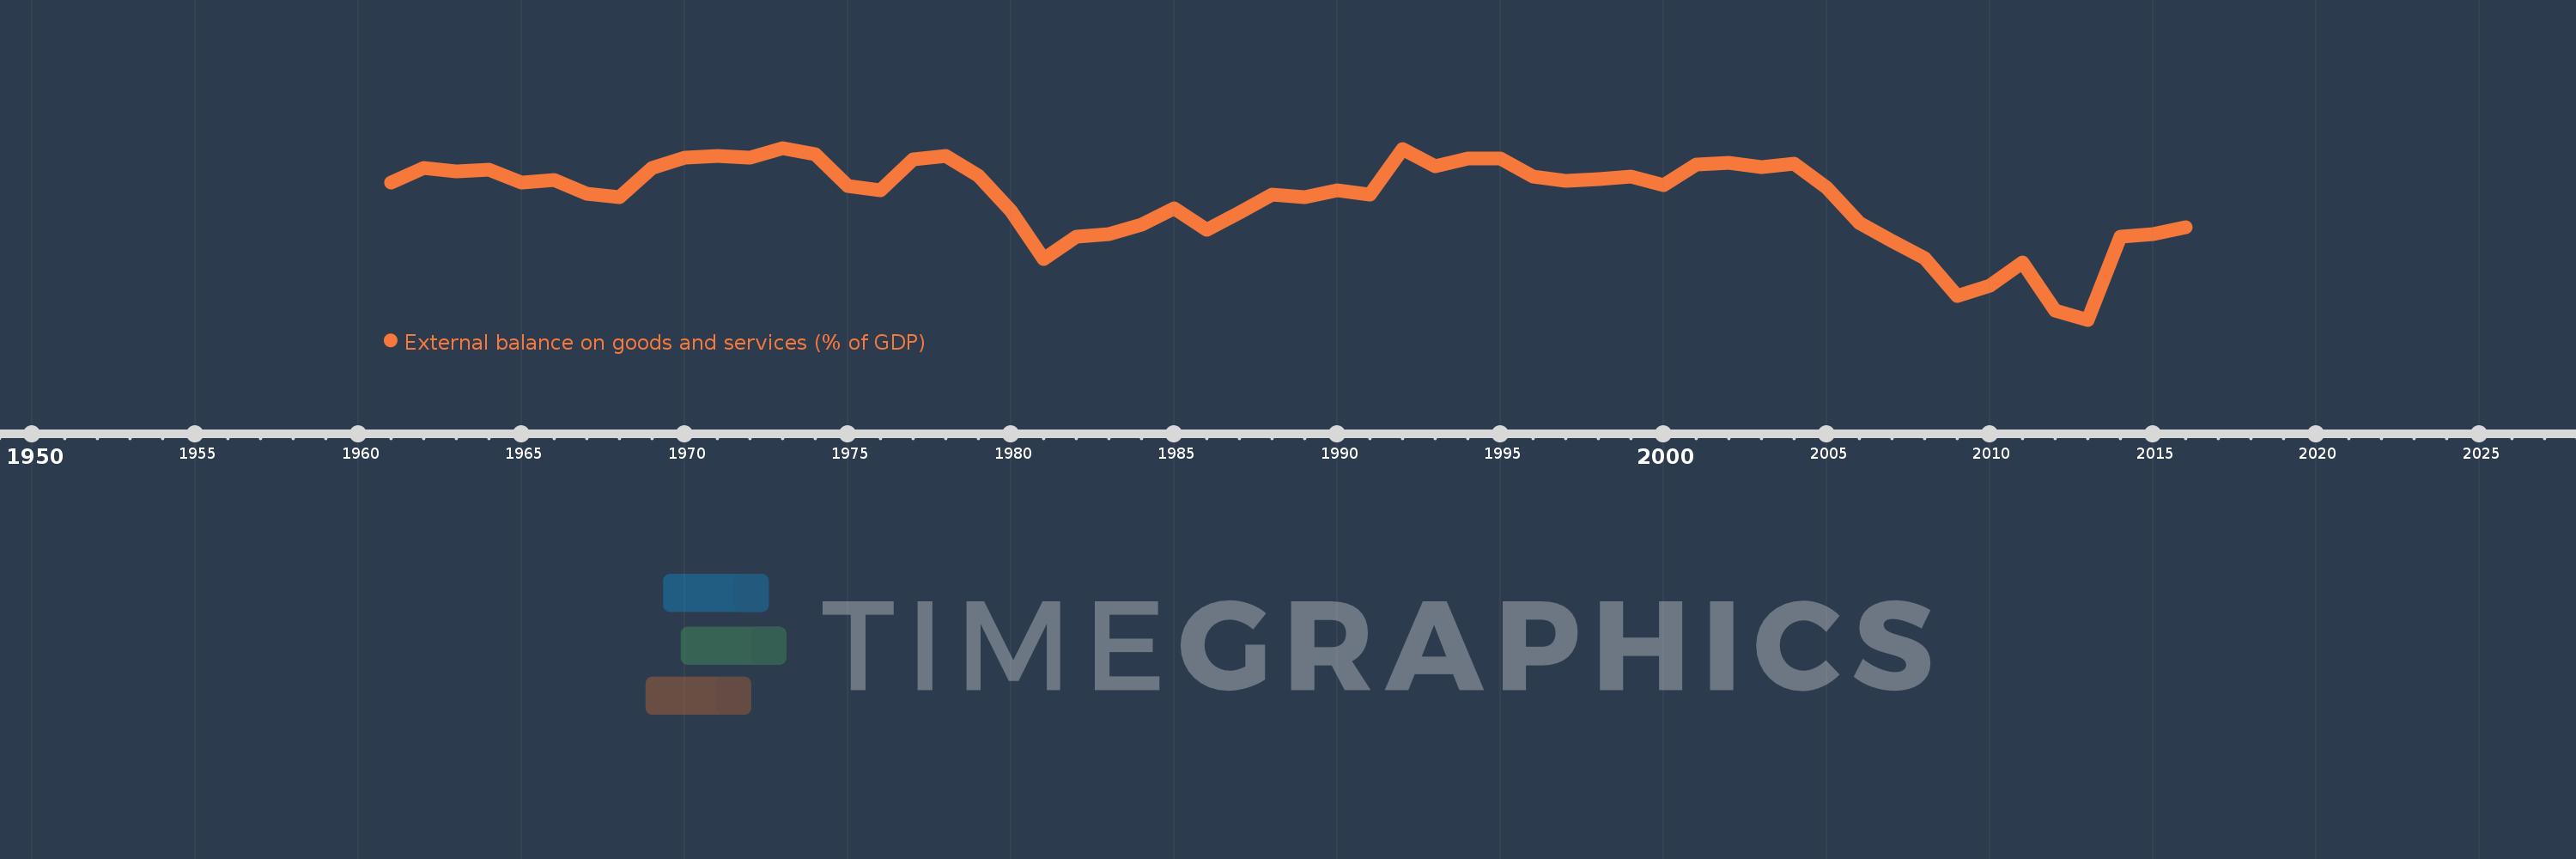
External balance on goods and services (% of GDP)
2016,2015,2014,2013,2012,2011,2010,2009,2008,2007,2006,2005,2004,2003,2002,2001,2000,1999,1998,1997,1996,1995,1994,1993,1992,1991,1990,1989,1988,1987,1986,1985,1984,1983,1982,1981,1980,1979,1978,1977,1976,1975,1974,1973,1972,1971,1970,1969,1968,1967,1966,1965,1964,1963,1962,1961
This statistics in other country:
AfghanistanAlbaniaAlgeriaAngolaAntigua and BarbudaArab WorldArgentinaArmeniaArubaAustraliaAustriaAzerbaijanBahamas, TheBahrainBangladeshBarbadosBelarusBelgiumBelizeBeninBermudaBhutanBoliviaBosnia and HerzegovinaBotswanaBrazilBrunei DarussalamBulgariaBurkina FasoBurundiCabo VerdeCambodiaCameroonCanadaCaribbean small statesCentral African RepublicCentral Europe and the BalticsChadChileChinaColombiaComorosCongo, Dem. Rep.Congo, Rep.Costa RicaCote d'IvoireCroatiaCubaCyprusCzech RepublicDenmarkDjiboutiDominicaDominican RepublicEarly-demographic dividendEast Asia & PacificEast Asia & Pacific (excluding high income)East Asia & Pacific (IDA & IBRD countries)EcuadorEgypt, Arab Rep.El SalvadorEquatorial GuineaEritreaEstoniaEthiopiaEuro areaEurope & Central AsiaEurope & Central Asia (excluding high income)Europe & Central Asia (IDA & IBRD countries)European UnionFaroe IslandsFijiFinlandFragile and conflict affected situationsFranceFrench PolynesiaGabonGambia, TheGeorgiaGermanyGhanaGreeceGrenadaGuatemalaGuineaGuinea-BissauGuyanaHaitiHeavily indebted poor countries (HIPC)High incomeHondurasHong Kong SAR, ChinaHungaryIBRD onlyIcelandIDA & IBRD totalIDA blendIDA onlyIDA totalIndiaIndonesiaIran, Islamic Rep.IraqIrelandIsraelItalyJamaicaJapanJordanKazakhstanKenyaKiribatiKorea, Rep.KosovoKuwaitKyrgyz RepublicLao PDRLate-demographic dividendLatin America & Caribbean Latin America & Caribbean (excluding high income)Latin America & the Caribbean (IDA & IBRD countries)LatviaLeast developed countries: UN classificationLebanonLesothoLiberiaLibyaLithuaniaLow & middle incomeLow incomeLower middle incomeLuxembourgMacao SAR, ChinaMacedonia, FYRMadagascarMalawiMalaysiaMaldivesMaliMaltaMauritaniaMauritiusMexicoMicronesia, Fed. Sts.Middle East & North AfricaMiddle East & North Africa (excluding high income)Middle East & North Africa (IDA & IBRD countries)Middle incomeMoldovaMongoliaMontenegroMoroccoMozambiqueMyanmarNamibiaNepalNetherlandsNew CaledoniaNew ZealandNicaraguaNigerNigeriaNorth AmericaNorwayOECD membersOmanOther small statesPacific island small statesPakistanPalauPanamaPapua New GuineaParaguayPeruPhilippinesPolandPortugalPost-demographic dividendPre-demographic dividendPuerto RicoQatarRomaniaRussian FederationRwandaSamoaSaudi ArabiaSenegalSerbiaSeychellesSierra LeoneSingaporeSlovak RepublicSloveniaSmall statesSolomon IslandsSomaliaSouth AfricaSouth AsiaSouth Asia (IDA & IBRD)South SudanSpainSri LankaSt. Kitts and NevisSt. LuciaSt. Vincent and the GrenadinesSub-Saharan Africa Sub-Saharan Africa (excluding high income)Sub-Saharan Africa (IDA & IBRD countries)SudanSurinameSwazilandSwedenSwitzerlandSyrian Arab RepublicTajikistanTanzaniaThailandTimor-LesteTogoTongaTrinidad and TobagoTunisiaTurkeyTurkmenistanUgandaUkraineUnited Arab EmiratesUnited KingdomUnited StatesUpper middle incomeUruguayUzbekistanVanuatuVenezuela, RBVietnamWest Bank and GazaWorldYemen, Rep.ZambiaZimbabwe Timeline:
This timeline shows a graph from 1961 to 2016 of South Asia (IDA & IBRD). No data until 1960. Number of actual observations by date: 56.
Source name:
World Development Indicators
Source organization:
World Bank national accounts data, and OECD National Accounts data files.
Categories, topics:
Economy & Growth, Trade
Last updated:
apr 23, 2017
Indicators value changes by year
Minimum:
-7.356
jan 1, 2013
Maximum:
-0.818
jan 1, 1973
At the date of observation
Value
Absolute change
Change from previous value
jan 1, 1961
-2.146
-2.146
0.0%
jan 1, 1962
-1.575
+0.571
-26.62%
jan 1, 1963
-1.72
-0.145
9.23%
jan 1, 1964
-1.658
+0.062
-3.63%
jan 1, 1965
-2.139
-0.481
28.99%
jan 1, 1966
-2.036
+0.103
-4.82%
jan 1, 1967
-2.572
-0.537
26.37%
jan 1, 1968
-2.689
-0.117
4.54%
jan 1, 1969
-1.575
+1.114
-41.44%
jan 1, 1970
-1.178
+0.397
-25.21%
jan 1, 1971
-1.11
+0.068
-5.77%
jan 1, 1972
-1.19
-0.081
7.27%
jan 1, 1973
-0.818
+0.373
-31.3%
jan 1, 1974
-1.068
-0.25
30.54%
jan 1, 1975
-2.253
-1.186
111.04%
jan 1, 1976
-2.439
-0.186
8.25%
jan 1, 1977
-1.256
+1.183
-48.51%
jan 1, 1978
-1.109
+0.147
-11.67%
jan 1, 1979
-1.881
-0.771
69.54%
jan 1, 1980
-3.22
-1.339
71.18%
jan 1, 1981
-5.036
-1.817
56.42%
jan 1, 1982
-4.195
+0.842
-16.71%
jan 1, 1983
-4.084
+0.111
-2.64%
jan 1, 1984
-3.745
+0.338
-8.29%
jan 1, 1985
-3.118
+0.627
-16.75%
jan 1, 1986
-3.932
-0.813
26.09%
jan 1, 1987
-3.268
+0.664
-16.88%
jan 1, 1988
-2.582
+0.686
-20.98%
jan 1, 1989
-2.684
-0.102
3.95%
jan 1, 1990
-2.428
+0.257
-9.57%
jan 1, 1991
-2.585
-0.157
6.47%
jan 1, 1992
-0.848
+1.737
-67.2%
jan 1, 1993
-1.521
-0.674
79.44%
jan 1, 1994
-1.229
+0.293
-19.25%
jan 1, 1995
-1.206
+0.023
-1.88%
jan 1, 1996
-1.92
-0.714
59.23%
jan 1, 1997
-2.075
-0.156
8.11%
jan 1, 1998
-2.016
+0.059
-2.83%
jan 1, 1999
-1.92
+0.097
-4.79%
jan 1, 2000
-2.225
-0.305
15.9%
jan 1, 2001
-1.462
+0.763
-34.28%
jan 1, 2002
-1.376
+0.086
-5.88%
jan 1, 2003
-1.534
-0.158
11.46%
jan 1, 2004
-1.42
+0.114
-7.41%
jan 1, 2005
-2.324
-0.904
63.62%
jan 1, 2006
-3.674
-1.35
58.09%
jan 1, 2007
-4.355
-0.681
18.55%
jan 1, 2008
-5.005
-0.65
14.92%
jan 1, 2009
-6.455
-1.45
28.96%
jan 1, 2010
-6.057
+0.398
-6.17%
jan 1, 2011
-5.173
+0.883
-14.59%
jan 1, 2012
-6.998
-1.824
35.27%
jan 1, 2013
-7.356
-0.358
5.12%
jan 1, 2014
-4.211
+3.145
-42.75%
jan 1, 2015
-4.111
+0.1
-2.38%
jan 1, 2016
-3.834
+0.277
-6.73%
Ranking of countries by current statistics by years


Comments: