29
/
en
AIzaSyAYiBZKx7MnpbEhh9jyipgxe19OcubqV5w
April 1, 2024
124732
Egypt, Arab Rep.
EGY
true
2
1
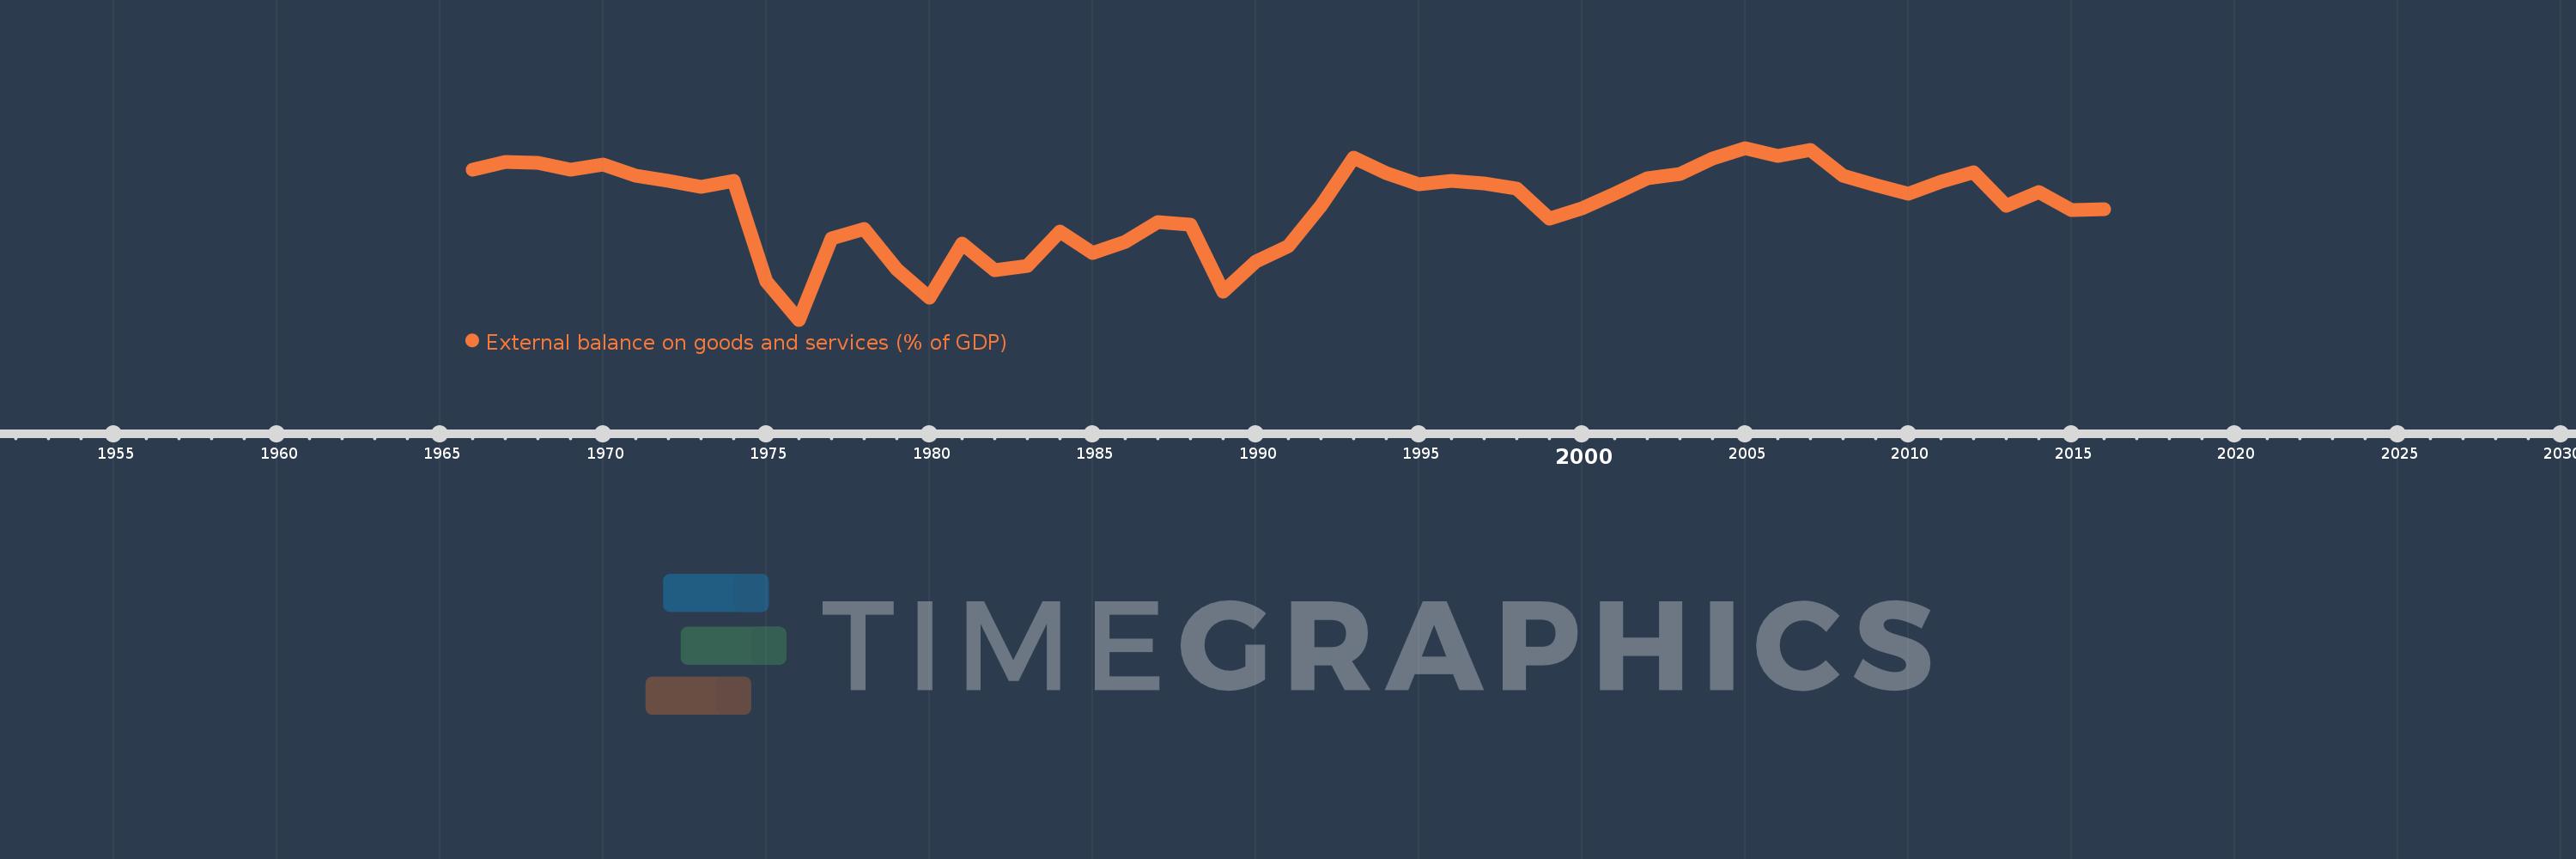
External balance on goods and services (% of GDP)
2016,2015,2014,2013,2012,2011,2010,2009,2008,2007,2006,2005,2004,2003,2002,2001,2000,1999,1998,1997,1996,1995,1994,1993,1992,1991,1990,1989,1988,1987,1986,1985,1984,1983,1982,1981,1980,1979,1978,1977,1976,1975,1974,1973,1972,1971,1970,1969,1968,1967,1966
This statistics in other country:
AfghanistanAlbaniaAlgeriaAngolaAntigua and BarbudaArab WorldArgentinaArmeniaArubaAustraliaAustriaAzerbaijanBahamas, TheBahrainBangladeshBarbadosBelarusBelgiumBelizeBeninBermudaBhutanBoliviaBosnia and HerzegovinaBotswanaBrazilBrunei DarussalamBulgariaBurkina FasoBurundiCabo VerdeCambodiaCameroonCanadaCaribbean small statesCentral African RepublicCentral Europe and the BalticsChadChileChinaColombiaComorosCongo, Dem. Rep.Congo, Rep.Costa RicaCote d'IvoireCroatiaCubaCyprusCzech RepublicDenmarkDjiboutiDominicaDominican RepublicEarly-demographic dividendEast Asia & PacificEast Asia & Pacific (excluding high income)East Asia & Pacific (IDA & IBRD countries)EcuadorEgypt, Arab Rep.El SalvadorEquatorial GuineaEritreaEstoniaEthiopiaEuro areaEurope & Central AsiaEurope & Central Asia (excluding high income)Europe & Central Asia (IDA & IBRD countries)European UnionFaroe IslandsFijiFinlandFragile and conflict affected situationsFranceFrench PolynesiaGabonGambia, TheGeorgiaGermanyGhanaGreeceGrenadaGuatemalaGuineaGuinea-BissauGuyanaHaitiHeavily indebted poor countries (HIPC)High incomeHondurasHong Kong SAR, ChinaHungaryIBRD onlyIcelandIDA & IBRD totalIDA blendIDA onlyIDA totalIndiaIndonesiaIran, Islamic Rep.IraqIrelandIsraelItalyJamaicaJapanJordanKazakhstanKenyaKiribatiKorea, Rep.KosovoKuwaitKyrgyz RepublicLao PDRLate-demographic dividendLatin America & Caribbean Latin America & Caribbean (excluding high income)Latin America & the Caribbean (IDA & IBRD countries)LatviaLeast developed countries: UN classificationLebanonLesothoLiberiaLibyaLithuaniaLow & middle incomeLow incomeLower middle incomeLuxembourgMacao SAR, ChinaMacedonia, FYRMadagascarMalawiMalaysiaMaldivesMaliMaltaMauritaniaMauritiusMexicoMicronesia, Fed. Sts.Middle East & North AfricaMiddle East & North Africa (excluding high income)Middle East & North Africa (IDA & IBRD countries)Middle incomeMoldovaMongoliaMontenegroMoroccoMozambiqueMyanmarNamibiaNepalNetherlandsNew CaledoniaNew ZealandNicaraguaNigerNigeriaNorth AmericaNorwayOECD membersOmanOther small statesPacific island small statesPakistanPalauPanamaPapua New GuineaParaguayPeruPhilippinesPolandPortugalPost-demographic dividendPre-demographic dividendPuerto RicoQatarRomaniaRussian FederationRwandaSamoaSaudi ArabiaSenegalSerbiaSeychellesSierra LeoneSingaporeSlovak RepublicSloveniaSmall statesSolomon IslandsSomaliaSouth AfricaSouth AsiaSouth Asia (IDA & IBRD)South SudanSpainSri LankaSt. Kitts and NevisSt. LuciaSt. Vincent and the GrenadinesSub-Saharan Africa Sub-Saharan Africa (excluding high income)Sub-Saharan Africa (IDA & IBRD countries)SudanSurinameSwazilandSwedenSwitzerlandSyrian Arab RepublicTajikistanTanzaniaThailandTimor-LesteTogoTongaTrinidad and TobagoTunisiaTurkeyTurkmenistanUgandaUkraineUnited Arab EmiratesUnited KingdomUnited StatesUpper middle incomeUruguayUzbekistanVanuatuVenezuela, RBVietnamWest Bank and GazaWorldYemen, Rep.ZambiaZimbabwe Timeline:
This timeline shows a graph from 1966 to 2016 of Egypt, Arab Rep.. No data until 1965. Number of actual observations by date: 51.
Source name:
World Development Indicators
Source organization:
World Bank national accounts data, and OECD National Accounts data files.
Categories, topics:
Economy & Growth, Trade
Last updated:
apr 23, 2017
Indicators value changes by year
At the date of observation
Value
Absolute change
Change from previous value
jan 1, 1966
-3.808
-3.808
0.0%
jan 1, 1967
-2.947
+0.861
-22.6%
jan 1, 1968
-3.115
-0.169
5.72%
jan 1, 1969
-3.809
-0.694
22.27%
jan 1, 1970
-3.303
+0.506
-13.29%
jan 1, 1971
-4.568
-1.265
38.3%
jan 1, 1972
-5.1
-0.532
11.66%
jan 1, 1973
-5.785
-0.685
13.43%
jan 1, 1974
-5.178
+0.607
-10.49%
jan 1, 1975
-16.732
-11.554
223.12%
jan 1, 1976
-21.1
-4.368
26.11%
jan 1, 1977
-11.729
+9.371
-44.41%
jan 1, 1978
-10.714
+1.015
-8.65%
jan 1, 1979
-15.273
-4.559
42.55%
jan 1, 1980
-18.607
-3.334
21.83%
jan 1, 1981
-12.351
+6.256
-33.62%
jan 1, 1982
-15.433
-3.082
24.95%
jan 1, 1983
-14.898
+0.535
-3.47%
jan 1, 1984
-10.947
+3.951
-26.52%
jan 1, 1985
-13.461
-2.514
22.96%
jan 1, 1986
-12.127
+1.334
-9.91%
jan 1, 1987
-9.863
+2.264
-18.67%
jan 1, 1988
-10.208
-0.345
3.5%
jan 1, 1989
-17.843
-7.635
74.8%
jan 1, 1990
-14.458
+3.385
-18.97%
jan 1, 1991
-12.666
+1.792
-12.4%
jan 1, 1992
-7.98
+4.686
-36.99%
jan 1, 1993
-2.516
+5.464
-68.47%
jan 1, 1994
-4.253
-1.736
69.01%
jan 1, 1995
-5.486
-1.233
29.0%
jan 1, 1996
-5.147
+0.339
-6.17%
jan 1, 1997
-5.449
-0.302
5.87%
jan 1, 1998
-6.055
-0.606
11.12%
jan 1, 1999
-9.499
-3.444
56.88%
jan 1, 2000
-8.257
+1.241
-13.07%
jan 1, 2001
-6.616
+1.642
-19.88%
jan 1, 2002
-4.851
+1.765
-26.68%
jan 1, 2003
-4.355
+0.496
-10.23%
jan 1, 2004
-2.587
+1.768
-40.6%
jan 1, 2005
-1.36
+1.227
-47.43%
jan 1, 2006
-2.266
-0.906
66.59%
jan 1, 2007
-1.619
+0.647
-28.54%
jan 1, 2008
-4.578
-2.96
182.81%
jan 1, 2009
-5.595
-1.016
22.2%
jan 1, 2010
-6.64
-1.045
18.68%
jan 1, 2011
-5.238
+1.402
-21.11%
jan 1, 2012
-4.121
+1.117
-21.33%
jan 1, 2013
-8.004
-3.884
94.24%
jan 1, 2014
-6.394
+1.61
-20.11%
jan 1, 2015
-8.545
-2.15
33.63%
jan 1, 2016
-8.441
+0.104
-1.21%
Ranking of countries by current statistics by years


Comments: