29
/
en
AIzaSyAYiBZKx7MnpbEhh9jyipgxe19OcubqV5w
April 1, 2024
287142
Zimbabwe
ZWE
true
2
1
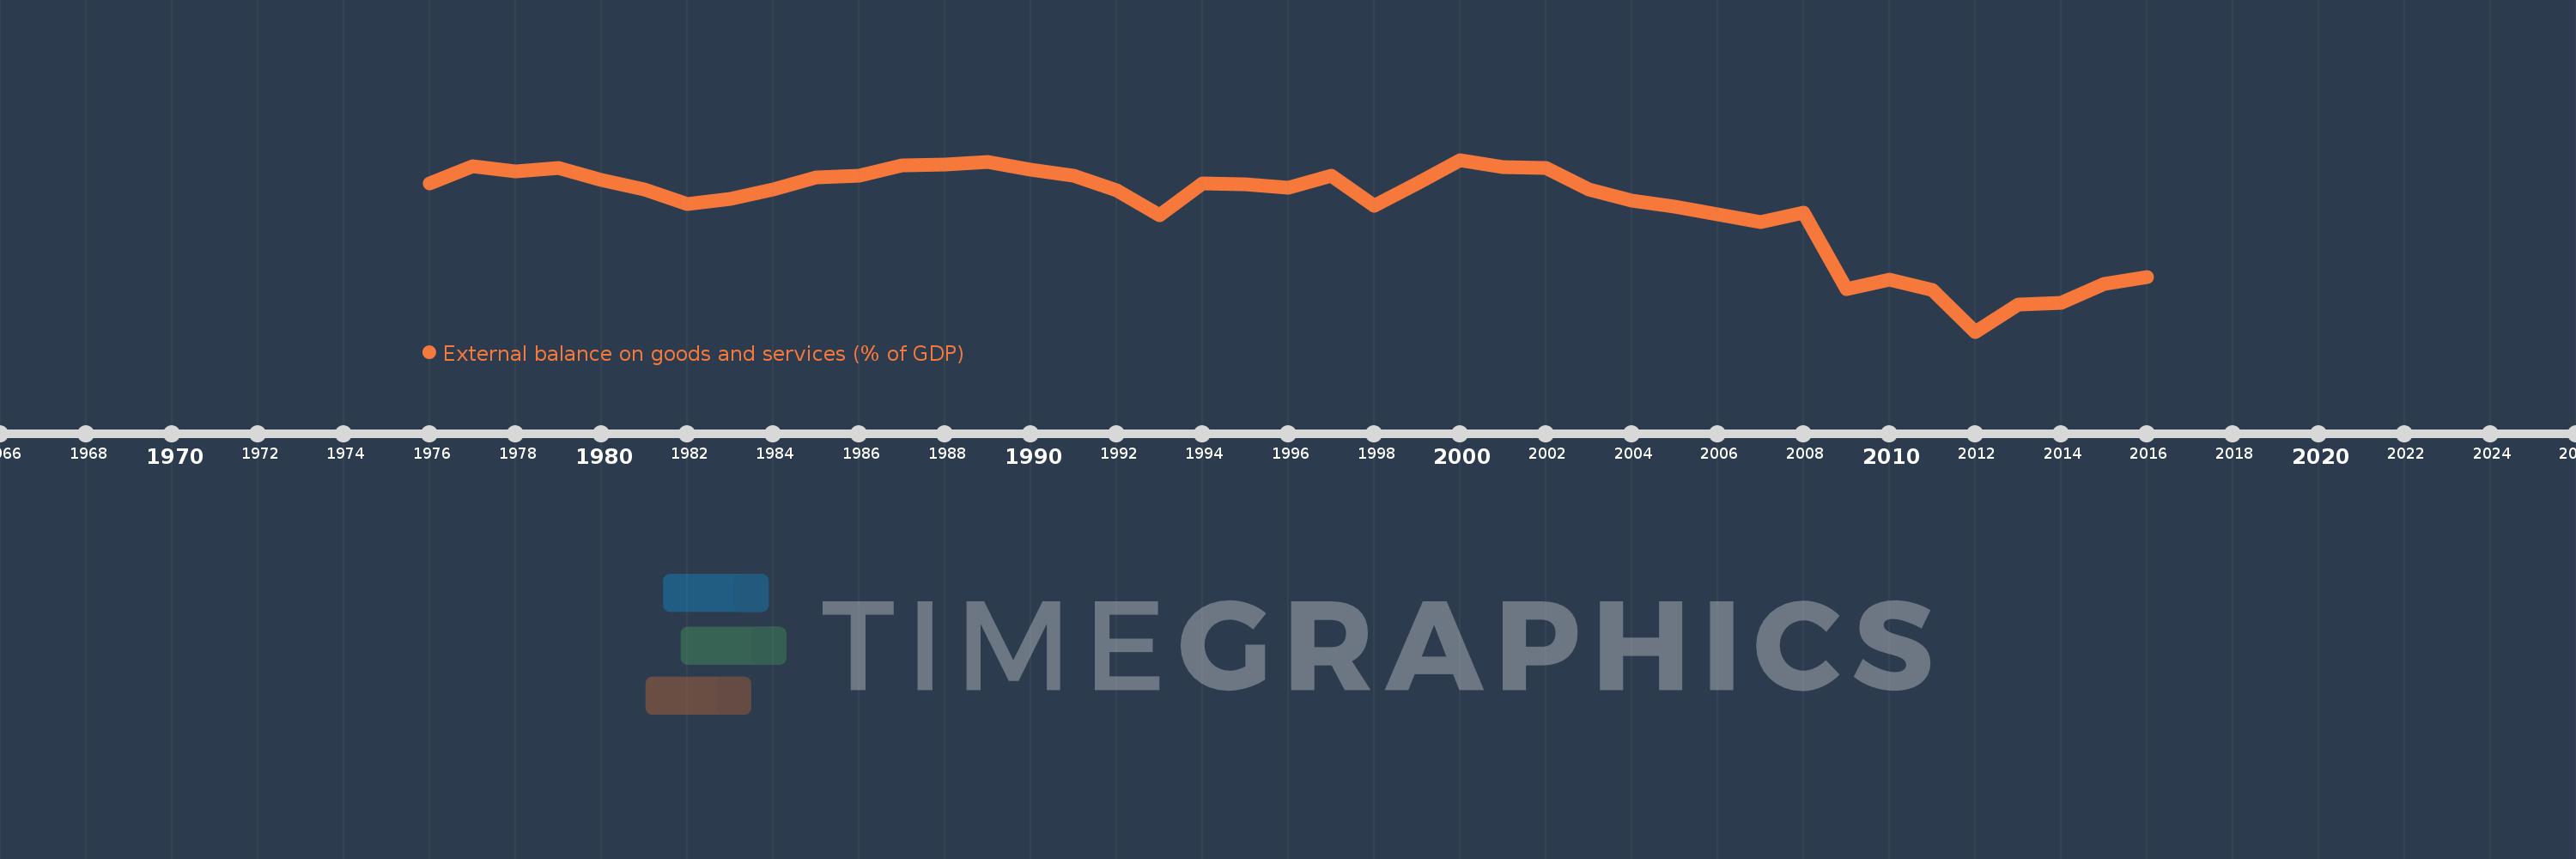
External balance on goods and services (% of GDP)
2016,2015,2014,2013,2012,2011,2010,2009,2008,2007,2006,2005,2004,2003,2002,2001,2000,1999,1998,1997,1996,1995,1994,1993,1992,1991,1990,1989,1988,1987,1986,1985,1984,1983,1982,1981,1980,1979,1978,1977,1976
This statistics in other country:
AfghanistanAlbaniaAlgeriaAngolaAntigua and BarbudaArab WorldArgentinaArmeniaArubaAustraliaAustriaAzerbaijanBahamas, TheBahrainBangladeshBarbadosBelarusBelgiumBelizeBeninBermudaBhutanBoliviaBosnia and HerzegovinaBotswanaBrazilBrunei DarussalamBulgariaBurkina FasoBurundiCabo VerdeCambodiaCameroonCanadaCaribbean small statesCentral African RepublicCentral Europe and the BalticsChadChileChinaColombiaComorosCongo, Dem. Rep.Congo, Rep.Costa RicaCote d'IvoireCroatiaCubaCyprusCzech RepublicDenmarkDjiboutiDominicaDominican RepublicEarly-demographic dividendEast Asia & PacificEast Asia & Pacific (excluding high income)East Asia & Pacific (IDA & IBRD countries)EcuadorEgypt, Arab Rep.El SalvadorEquatorial GuineaEritreaEstoniaEthiopiaEuro areaEurope & Central AsiaEurope & Central Asia (excluding high income)Europe & Central Asia (IDA & IBRD countries)European UnionFaroe IslandsFijiFinlandFragile and conflict affected situationsFranceFrench PolynesiaGabonGambia, TheGeorgiaGermanyGhanaGreeceGrenadaGuatemalaGuineaGuinea-BissauGuyanaHaitiHeavily indebted poor countries (HIPC)High incomeHondurasHong Kong SAR, ChinaHungaryIBRD onlyIcelandIDA & IBRD totalIDA blendIDA onlyIDA totalIndiaIndonesiaIran, Islamic Rep.IraqIrelandIsraelItalyJamaicaJapanJordanKazakhstanKenyaKiribatiKorea, Rep.KosovoKuwaitKyrgyz RepublicLao PDRLate-demographic dividendLatin America & Caribbean Latin America & Caribbean (excluding high income)Latin America & the Caribbean (IDA & IBRD countries)LatviaLeast developed countries: UN classificationLebanonLesothoLiberiaLibyaLithuaniaLow & middle incomeLow incomeLower middle incomeLuxembourgMacao SAR, ChinaMacedonia, FYRMadagascarMalawiMalaysiaMaldivesMaliMaltaMauritaniaMauritiusMexicoMicronesia, Fed. Sts.Middle East & North AfricaMiddle East & North Africa (excluding high income)Middle East & North Africa (IDA & IBRD countries)Middle incomeMoldovaMongoliaMontenegroMoroccoMozambiqueMyanmarNamibiaNepalNetherlandsNew CaledoniaNew ZealandNicaraguaNigerNigeriaNorth AmericaNorwayOECD membersOmanOther small statesPacific island small statesPakistanPalauPanamaPapua New GuineaParaguayPeruPhilippinesPolandPortugalPost-demographic dividendPre-demographic dividendPuerto RicoQatarRomaniaRussian FederationRwandaSamoaSaudi ArabiaSenegalSerbiaSeychellesSierra LeoneSingaporeSlovak RepublicSloveniaSmall statesSolomon IslandsSomaliaSouth AfricaSouth AsiaSouth Asia (IDA & IBRD)South SudanSpainSri LankaSt. Kitts and NevisSt. LuciaSt. Vincent and the GrenadinesSub-Saharan Africa Sub-Saharan Africa (excluding high income)Sub-Saharan Africa (IDA & IBRD countries)SudanSurinameSwazilandSwedenSwitzerlandSyrian Arab RepublicTajikistanTanzaniaThailandTimor-LesteTogoTongaTrinidad and TobagoTunisiaTurkeyTurkmenistanUgandaUkraineUnited Arab EmiratesUnited KingdomUnited StatesUpper middle incomeUruguayUzbekistanVanuatuVenezuela, RBVietnamWest Bank and GazaWorldYemen, Rep.ZambiaZimbabwe Timeline:
This timeline shows a graph from 1976 to 2016 of Zimbabwe. No data until 1975. Number of actual observations by date: 41.
Source name:
World Development Indicators
Source organization:
World Bank national accounts data, and OECD National Accounts data files.
Categories, topics:
Economy & Growth, Trade
Last updated:
apr 23, 2017
Indicators value changes by year
Minimum:
-36.712
jan 1, 2012
At the date of observation
Value
Absolute change
Change from previous value
jan 1, 1976
-1.669
-1.669
0.0%
jan 1, 1977
2.363
+4.032
-241.62%
jan 1, 1978
1.177
-1.186
-50.18%
jan 1, 1979
2.036
+0.859
72.94%
jan 1, 1980
-0.861
-2.897
-142.29%
jan 1, 1981
-3.156
-2.295
266.45%
jan 1, 1982
-6.48
-3.325
105.35%
jan 1, 1983
-5.294
+1.186
-18.3%
jan 1, 1984
-3.031
+2.263
-42.75%
jan 1, 1985
-0.244
+2.787
-91.95%
jan 1, 1986
0.198
+0.442
-181.14%
jan 1, 1987
2.528
+2.331
1.18K%
jan 1, 1988
2.741
+0.212
8.4%
jan 1, 1989
3.38
+0.64
23.33%
jan 1, 1990
1.622
-1.758
-52.02%
jan 1, 1991
0.074
-1.548
-95.41%
jan 1, 1992
-3.285
-3.359
-4.51K%
jan 1, 1993
-9.258
-5.973
181.86%
jan 1, 1994
-1.728
+7.53
-81.34%
jan 1, 1995
-1.92
-0.192
11.1%
jan 1, 1996
-2.684
-0.765
39.83%
jan 1, 1997
0.191
+2.875
-107.1%
jan 1, 1998
-7.015
-7.205
-3.78K%
jan 1, 1999
-1.728
+5.287
-75.37%
jan 1, 2000
3.894
+5.622
-325.39%
jan 1, 2001
2.252
-1.642
-42.17%
jan 1, 2002
2.02
-0.232
-10.31%
jan 1, 2003
-3.138
-5.158
-255.34%
jan 1, 2004
-5.658
-2.52
80.32%
jan 1, 2005
-7.1
-1.442
25.49%
jan 1, 2006
-8.946
-1.846
26.01%
jan 1, 2007
-10.908
-1.962
21.93%
jan 1, 2008
-8.602
+2.306
-21.14%
jan 1, 2009
-26.588
-17.986
209.08%
jan 1, 2010
-24.452
+2.136
-8.03%
jan 1, 2011
-26.809
-2.357
9.64%
jan 1, 2012
-36.712
-9.903
36.94%
jan 1, 2013
-30.323
+6.389
-17.4%
jan 1, 2014
-29.898
+0.425
-1.4%
jan 1, 2015
-25.438
+4.46
-14.92%
jan 1, 2016
-23.785
+1.653
-6.5%
Ranking of countries by current statistics by years


Comments: