29
/
en
AIzaSyAYiBZKx7MnpbEhh9jyipgxe19OcubqV5w
April 1, 2024
188968
Maldives
MDV
true
2
1
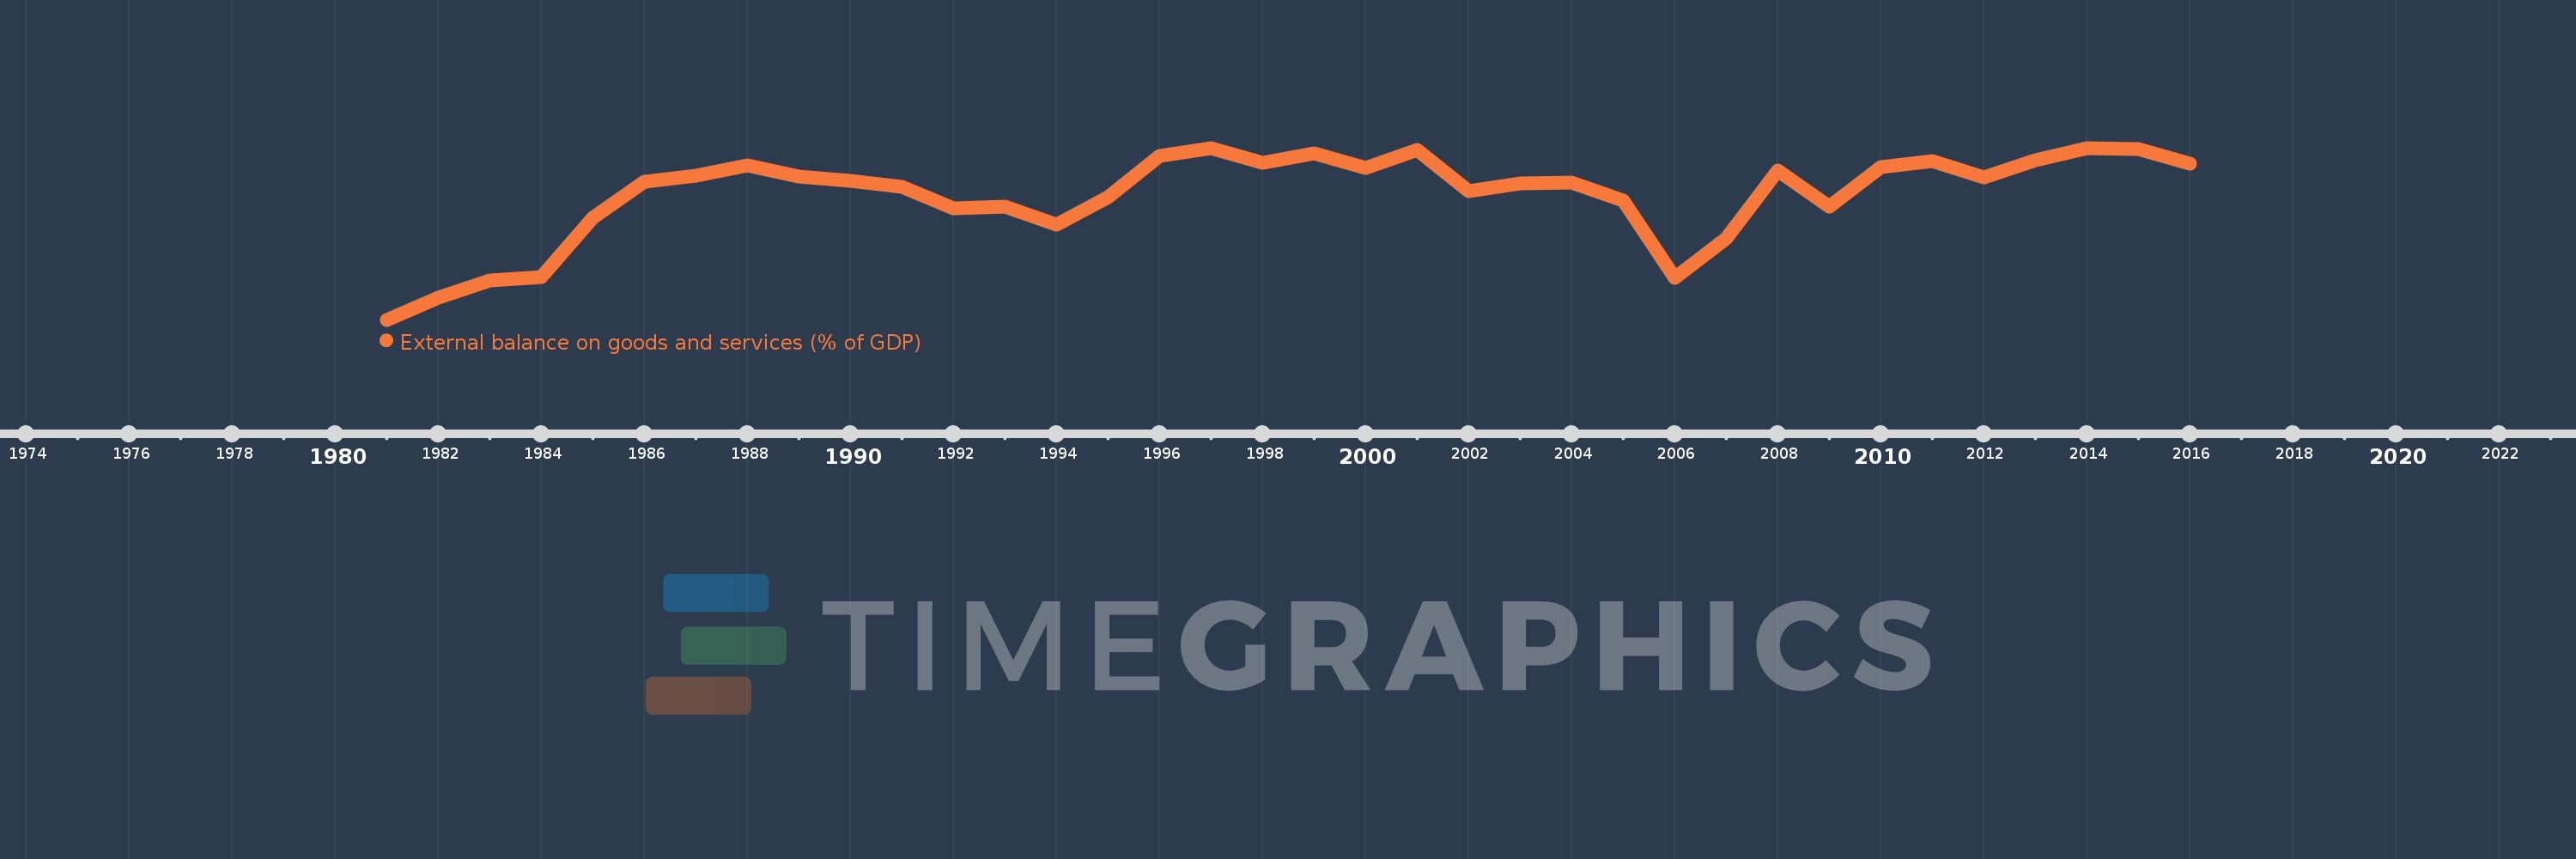
External balance on goods and services (% of GDP)
2016,2015,2014,2013,2012,2011,2010,2009,2008,2007,2006,2005,2004,2003,2002,2001,2000,1999,1998,1997,1996,1995,1994,1993,1992,1991,1990,1989,1988,1987,1986,1985,1984,1983,1982,1981
This statistics in other country:
AfghanistanAlbaniaAlgeriaAngolaAntigua and BarbudaArab WorldArgentinaArmeniaArubaAustraliaAustriaAzerbaijanBahamas, TheBahrainBangladeshBarbadosBelarusBelgiumBelizeBeninBermudaBhutanBoliviaBosnia and HerzegovinaBotswanaBrazilBrunei DarussalamBulgariaBurkina FasoBurundiCabo VerdeCambodiaCameroonCanadaCaribbean small statesCentral African RepublicCentral Europe and the BalticsChadChileChinaColombiaComorosCongo, Dem. Rep.Congo, Rep.Costa RicaCote d'IvoireCroatiaCubaCyprusCzech RepublicDenmarkDjiboutiDominicaDominican RepublicEarly-demographic dividendEast Asia & PacificEast Asia & Pacific (excluding high income)East Asia & Pacific (IDA & IBRD countries)EcuadorEgypt, Arab Rep.El SalvadorEquatorial GuineaEritreaEstoniaEthiopiaEuro areaEurope & Central AsiaEurope & Central Asia (excluding high income)Europe & Central Asia (IDA & IBRD countries)European UnionFaroe IslandsFijiFinlandFragile and conflict affected situationsFranceFrench PolynesiaGabonGambia, TheGeorgiaGermanyGhanaGreeceGrenadaGuatemalaGuineaGuinea-BissauGuyanaHaitiHeavily indebted poor countries (HIPC)High incomeHondurasHong Kong SAR, ChinaHungaryIBRD onlyIcelandIDA & IBRD totalIDA blendIDA onlyIDA totalIndiaIndonesiaIran, Islamic Rep.IraqIrelandIsraelItalyJamaicaJapanJordanKazakhstanKenyaKiribatiKorea, Rep.KosovoKuwaitKyrgyz RepublicLao PDRLate-demographic dividendLatin America & Caribbean Latin America & Caribbean (excluding high income)Latin America & the Caribbean (IDA & IBRD countries)LatviaLeast developed countries: UN classificationLebanonLesothoLiberiaLibyaLithuaniaLow & middle incomeLow incomeLower middle incomeLuxembourgMacao SAR, ChinaMacedonia, FYRMadagascarMalawiMalaysiaMaldivesMaliMaltaMauritaniaMauritiusMexicoMicronesia, Fed. Sts.Middle East & North AfricaMiddle East & North Africa (excluding high income)Middle East & North Africa (IDA & IBRD countries)Middle incomeMoldovaMongoliaMontenegroMoroccoMozambiqueMyanmarNamibiaNepalNetherlandsNew CaledoniaNew ZealandNicaraguaNigerNigeriaNorth AmericaNorwayOECD membersOmanOther small statesPacific island small statesPakistanPalauPanamaPapua New GuineaParaguayPeruPhilippinesPolandPortugalPost-demographic dividendPre-demographic dividendPuerto RicoQatarRomaniaRussian FederationRwandaSamoaSaudi ArabiaSenegalSerbiaSeychellesSierra LeoneSingaporeSlovak RepublicSloveniaSmall statesSolomon IslandsSomaliaSouth AfricaSouth AsiaSouth Asia (IDA & IBRD)South SudanSpainSri LankaSt. Kitts and NevisSt. LuciaSt. Vincent and the GrenadinesSub-Saharan Africa Sub-Saharan Africa (excluding high income)Sub-Saharan Africa (IDA & IBRD countries)SudanSurinameSwazilandSwedenSwitzerlandSyrian Arab RepublicTajikistanTanzaniaThailandTimor-LesteTogoTongaTrinidad and TobagoTunisiaTurkeyTurkmenistanUgandaUkraineUnited Arab EmiratesUnited KingdomUnited StatesUpper middle incomeUruguayUzbekistanVanuatuVenezuela, RBVietnamWest Bank and GazaWorldYemen, Rep.ZambiaZimbabwe Timeline:
This timeline shows a graph from 1981 to 2016 of Maldives. No data until 1980. Number of actual observations by date: 36.
Source name:
World Development Indicators
Source organization:
World Bank national accounts data, and OECD National Accounts data files.
Categories, topics:
Economy & Growth, Trade
Last updated:
apr 23, 2017
Indicators value changes by year
Minimum:
-51.574
jan 1, 1981
Maximum:
18.771
jan 1, 2014
At the date of observation
Value
Absolute change
Change from previous value
jan 1, 1981
-51.574
-51.574
0.0%
jan 1, 1982
-42.652
+8.922
-17.3%
jan 1, 1983
-35.673
+6.979
-16.36%
jan 1, 1984
-34.238
+1.434
-4.02%
jan 1, 1985
-9.771
+24.467
-71.46%
jan 1, 1986
4.797
+14.569
-149.1%
jan 1, 1987
7.329
+2.532
52.77%
jan 1, 1988
11.538
+4.209
57.43%
jan 1, 1989
7.176
-4.362
-37.8%
jan 1, 1990
5.223
-1.953
-27.21%
jan 1, 1991
2.826
-2.397
-45.89%
jan 1, 1992
-5.931
-8.758
-309.86%
jan 1, 1993
-5.279
+0.652
-10.99%
jan 1, 1994
-12.597
-7.317
138.6%
jan 1, 1995
-1.474
+11.122
-88.3%
jan 1, 1996
15.46
+16.934
-1.15K%
jan 1, 1997
18.617
+3.158
20.42%
jan 1, 1998
12.767
-5.85
-31.42%
jan 1, 1999
16.65
+3.883
30.41%
jan 1, 2000
10.58
-6.07
-36.45%
jan 1, 2001
17.855
+7.274
68.75%
jan 1, 2002
0.933
-16.921
-94.77%
jan 1, 2003
4.331
+3.398
364.04%
jan 1, 2004
4.732
+0.401
9.25%
jan 1, 2005
-2.801
-7.533
-159.19%
jan 1, 2006
-34.29
-31.489
1.12K%
jan 1, 2007
-18.266
+16.024
-46.73%
jan 1, 2008
9.633
+27.9
-152.74%
jan 1, 2009
-5.081
-14.714
-152.75%
jan 1, 2010
10.802
+15.883
-312.58%
jan 1, 2011
13.525
+2.723
25.2%
jan 1, 2012
6.592
-6.932
-51.26%
jan 1, 2013
13.777
+7.185
108.99%
jan 1, 2014
18.771
+4.994
36.25%
jan 1, 2015
18.453
-0.317
-1.69%
jan 1, 2016
12.18
-6.273
-34.0%
Ranking of countries by current statistics by years


Comments: