29
/
en
AIzaSyAYiBZKx7MnpbEhh9jyipgxe19OcubqV5w
April 1, 2024
87160
Bolivia
BOL
true
2
1
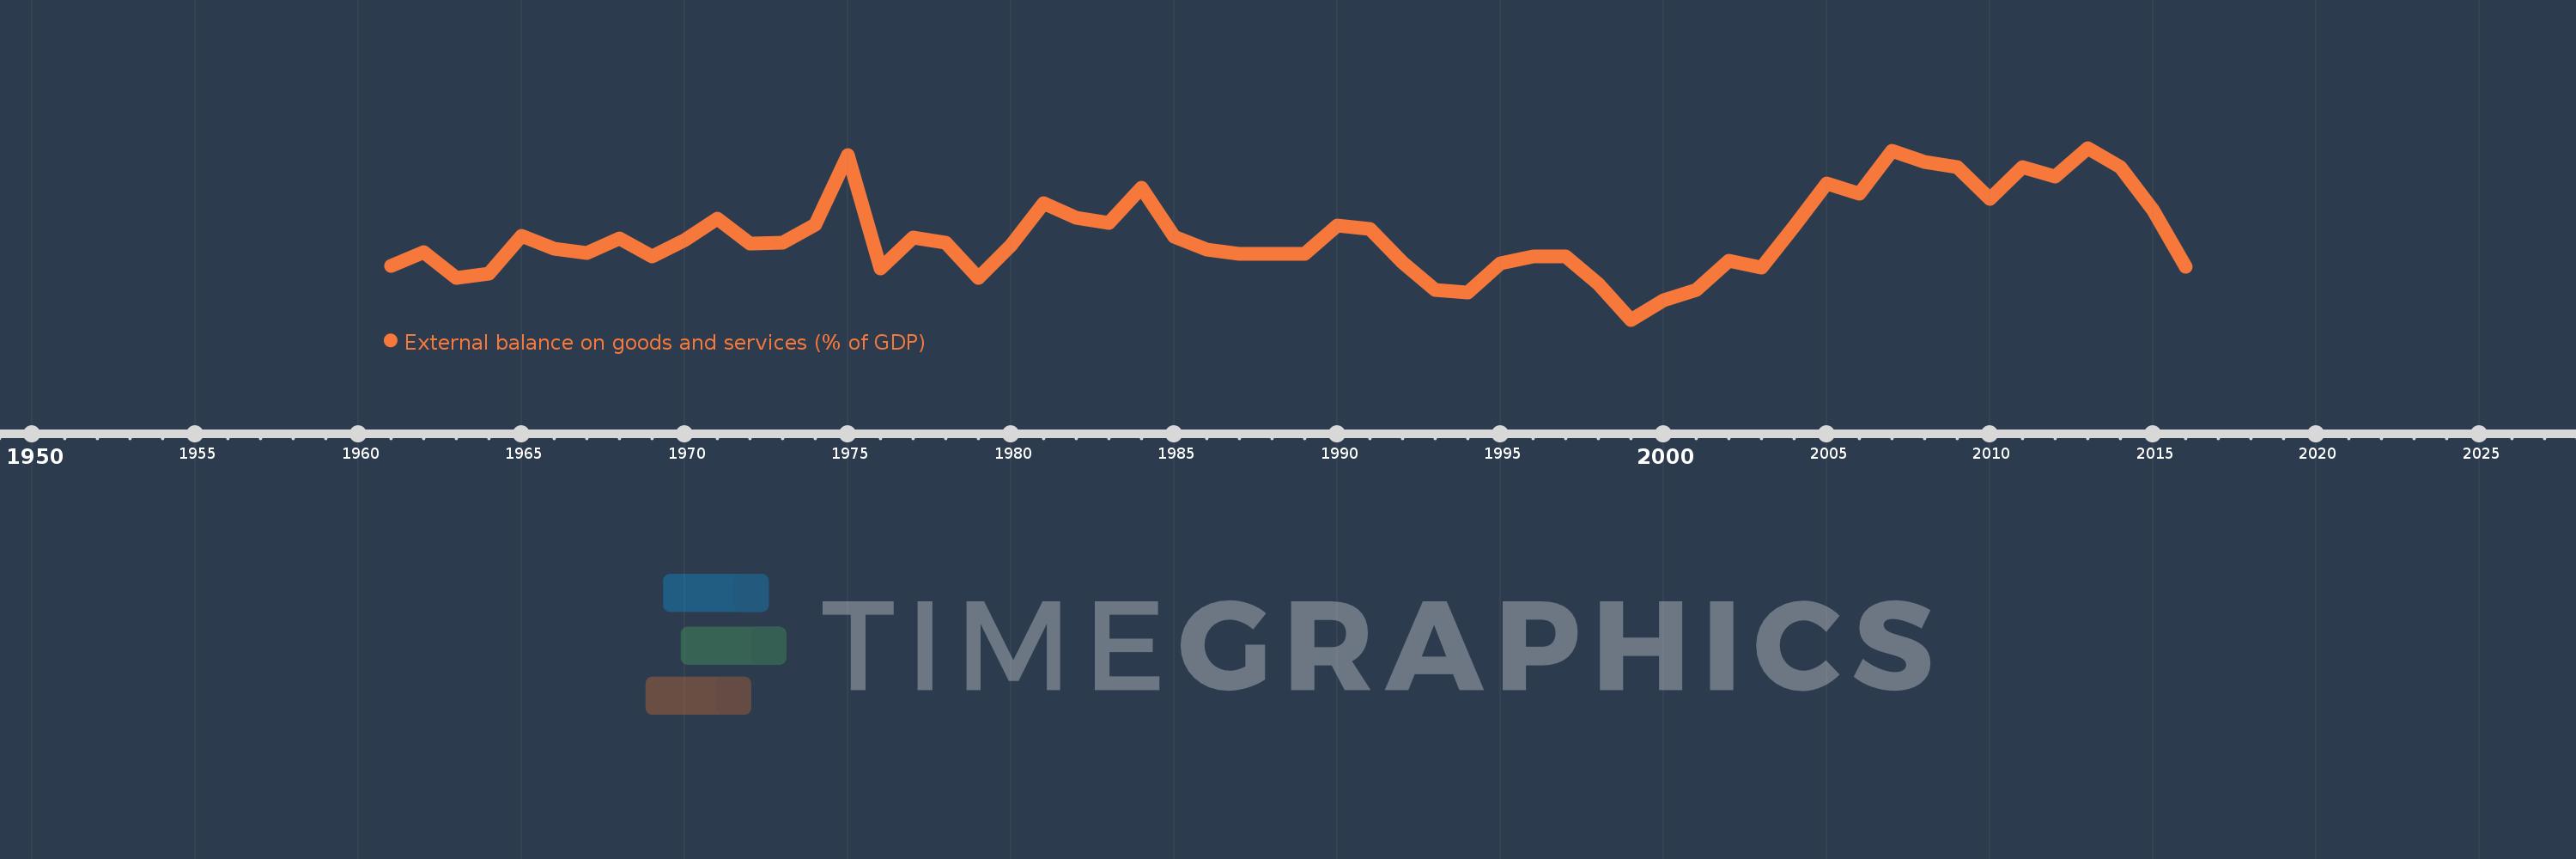
External balance on goods and services (% of GDP)
2016,2015,2014,2013,2012,2011,2010,2009,2008,2007,2006,2005,2004,2003,2002,2001,2000,1999,1998,1997,1996,1995,1994,1993,1992,1991,1990,1989,1988,1987,1986,1985,1984,1983,1982,1981,1980,1979,1978,1977,1976,1975,1974,1973,1972,1971,1970,1969,1968,1967,1966,1965,1964,1963,1962,1961
This statistics in other country:
AfghanistanAlbaniaAlgeriaAngolaAntigua and BarbudaArab WorldArgentinaArmeniaArubaAustraliaAustriaAzerbaijanBahamas, TheBahrainBangladeshBarbadosBelarusBelgiumBelizeBeninBermudaBhutanBoliviaBosnia and HerzegovinaBotswanaBrazilBrunei DarussalamBulgariaBurkina FasoBurundiCabo VerdeCambodiaCameroonCanadaCaribbean small statesCentral African RepublicCentral Europe and the BalticsChadChileChinaColombiaComorosCongo, Dem. Rep.Congo, Rep.Costa RicaCote d'IvoireCroatiaCubaCyprusCzech RepublicDenmarkDjiboutiDominicaDominican RepublicEarly-demographic dividendEast Asia & PacificEast Asia & Pacific (excluding high income)East Asia & Pacific (IDA & IBRD countries)EcuadorEgypt, Arab Rep.El SalvadorEquatorial GuineaEritreaEstoniaEthiopiaEuro areaEurope & Central AsiaEurope & Central Asia (excluding high income)Europe & Central Asia (IDA & IBRD countries)European UnionFaroe IslandsFijiFinlandFragile and conflict affected situationsFranceFrench PolynesiaGabonGambia, TheGeorgiaGermanyGhanaGreeceGrenadaGuatemalaGuineaGuinea-BissauGuyanaHaitiHeavily indebted poor countries (HIPC)High incomeHondurasHong Kong SAR, ChinaHungaryIBRD onlyIcelandIDA & IBRD totalIDA blendIDA onlyIDA totalIndiaIndonesiaIran, Islamic Rep.IraqIrelandIsraelItalyJamaicaJapanJordanKazakhstanKenyaKiribatiKorea, Rep.KosovoKuwaitKyrgyz RepublicLao PDRLate-demographic dividendLatin America & Caribbean Latin America & Caribbean (excluding high income)Latin America & the Caribbean (IDA & IBRD countries)LatviaLeast developed countries: UN classificationLebanonLesothoLiberiaLibyaLithuaniaLow & middle incomeLow incomeLower middle incomeLuxembourgMacao SAR, ChinaMacedonia, FYRMadagascarMalawiMalaysiaMaldivesMaliMaltaMauritaniaMauritiusMexicoMicronesia, Fed. Sts.Middle East & North AfricaMiddle East & North Africa (excluding high income)Middle East & North Africa (IDA & IBRD countries)Middle incomeMoldovaMongoliaMontenegroMoroccoMozambiqueMyanmarNamibiaNepalNetherlandsNew CaledoniaNew ZealandNicaraguaNigerNigeriaNorth AmericaNorwayOECD membersOmanOther small statesPacific island small statesPakistanPalauPanamaPapua New GuineaParaguayPeruPhilippinesPolandPortugalPost-demographic dividendPre-demographic dividendPuerto RicoQatarRomaniaRussian FederationRwandaSamoaSaudi ArabiaSenegalSerbiaSeychellesSierra LeoneSingaporeSlovak RepublicSloveniaSmall statesSolomon IslandsSomaliaSouth AfricaSouth AsiaSouth Asia (IDA & IBRD)South SudanSpainSri LankaSt. Kitts and NevisSt. LuciaSt. Vincent and the GrenadinesSub-Saharan Africa Sub-Saharan Africa (excluding high income)Sub-Saharan Africa (IDA & IBRD countries)SudanSurinameSwazilandSwedenSwitzerlandSyrian Arab RepublicTajikistanTanzaniaThailandTimor-LesteTogoTongaTrinidad and TobagoTunisiaTurkeyTurkmenistanUgandaUkraineUnited Arab EmiratesUnited KingdomUnited StatesUpper middle incomeUruguayUzbekistanVanuatuVenezuela, RBVietnamWest Bank and GazaWorldYemen, Rep.ZambiaZimbabwe Timeline:
This timeline shows a graph from 1961 to 2016 of Bolivia. No data until 1960. Number of actual observations by date: 56.
Source name:
World Development Indicators
Source organization:
World Bank national accounts data, and OECD National Accounts data files.
Categories, topics:
Economy & Growth, Trade
Last updated:
apr 23, 2017
Indicators value changes by year
Minimum:
-12.884
jan 1, 1999
At the date of observation
Value
Absolute change
Change from previous value
jan 1, 1961
-5.929
-5.929
0.0%
jan 1, 1962
-4.088
+1.841
-31.05%
jan 1, 1963
-7.478
-3.39
82.92%
jan 1, 1964
-6.945
+0.533
-7.13%
jan 1, 1965
-2.055
+4.89
-70.42%
jan 1, 1966
-3.705
-1.65
80.3%
jan 1, 1967
-4.234
-0.529
14.29%
jan 1, 1968
-2.329
+1.905
-44.98%
jan 1, 1969
-4.631
-2.301
98.79%
jan 1, 1970
-2.618
+2.013
-43.47%
jan 1, 1971
0.24
+2.858
-109.17%
jan 1, 1972
-3.012
-3.252
-1.36K%
jan 1, 1973
-2.907
+0.105
-3.5%
jan 1, 1974
-0.605
+2.301
-79.17%
jan 1, 1975
8.495
+9.1
-1.5K%
jan 1, 1976
-6.278
-14.773
-173.91%
jan 1, 1977
-2.21
+4.069
-64.8%
jan 1, 1978
-2.872
-0.663
29.99%
jan 1, 1979
-7.513
-4.641
161.57%
jan 1, 1980
-3.221
+4.292
-57.12%
jan 1, 1981
2.242
+5.463
-169.6%
jan 1, 1982
0.312
-1.93
-86.07%
jan 1, 1983
-0.34
-0.652
-208.74%
jan 1, 1984
4.278
+4.617
-1.36K%
jan 1, 1985
-2.165
-6.443
-150.61%
jan 1, 1986
-3.793
-1.628
75.19%
jan 1, 1987
-4.383
-0.59
15.57%
jan 1, 1988
-4.362
+0.022
-0.49%
jan 1, 1989
-4.371
-0.01
0.22%
jan 1, 1990
-0.658
+3.713
-84.94%
jan 1, 1991
-1.149
-0.491
74.6%
jan 1, 1992
-5.486
-4.337
377.35%
jan 1, 1993
-9.019
-3.533
64.4%
jan 1, 1994
-9.306
-0.286
3.17%
jan 1, 1995
-5.534
+3.771
-40.53%
jan 1, 1996
-4.635
+0.899
-16.25%
jan 1, 1997
-4.693
-0.057
1.24%
jan 1, 1998
-8.248
-3.556
75.78%
jan 1, 1999
-12.884
-4.635
56.2%
jan 1, 2000
-10.406
+2.477
-19.23%
jan 1, 2001
-9.048
+1.358
-13.05%
jan 1, 2002
-5.284
+3.765
-41.61%
jan 1, 2003
-6.081
-0.798
15.1%
jan 1, 2004
-0.766
+5.315
-87.4%
jan 1, 2005
4.813
+5.579
-727.96%
jan 1, 2006
3.454
-1.358
-28.22%
jan 1, 2007
9.006
+5.551
160.7%
jan 1, 2008
7.529
-1.476
-16.39%
jan 1, 2009
6.946
-0.584
-7.75%
jan 1, 2010
2.818
-4.128
-59.43%
jan 1, 2011
6.863
+4.045
143.55%
jan 1, 2012
5.703
-1.16
-16.9%
jan 1, 2013
9.383
+3.68
64.53%
jan 1, 2014
6.954
-2.429
-25.89%
jan 1, 2015
1.322
-5.632
-80.99%
jan 1, 2016
-6.062
-7.384
-558.57%
Ranking of countries by current statistics by years


Comments: