29
/
en
AIzaSyAYiBZKx7MnpbEhh9jyipgxe19OcubqV5w
April 1, 2024
64643
Albania
ALB
true
2
1
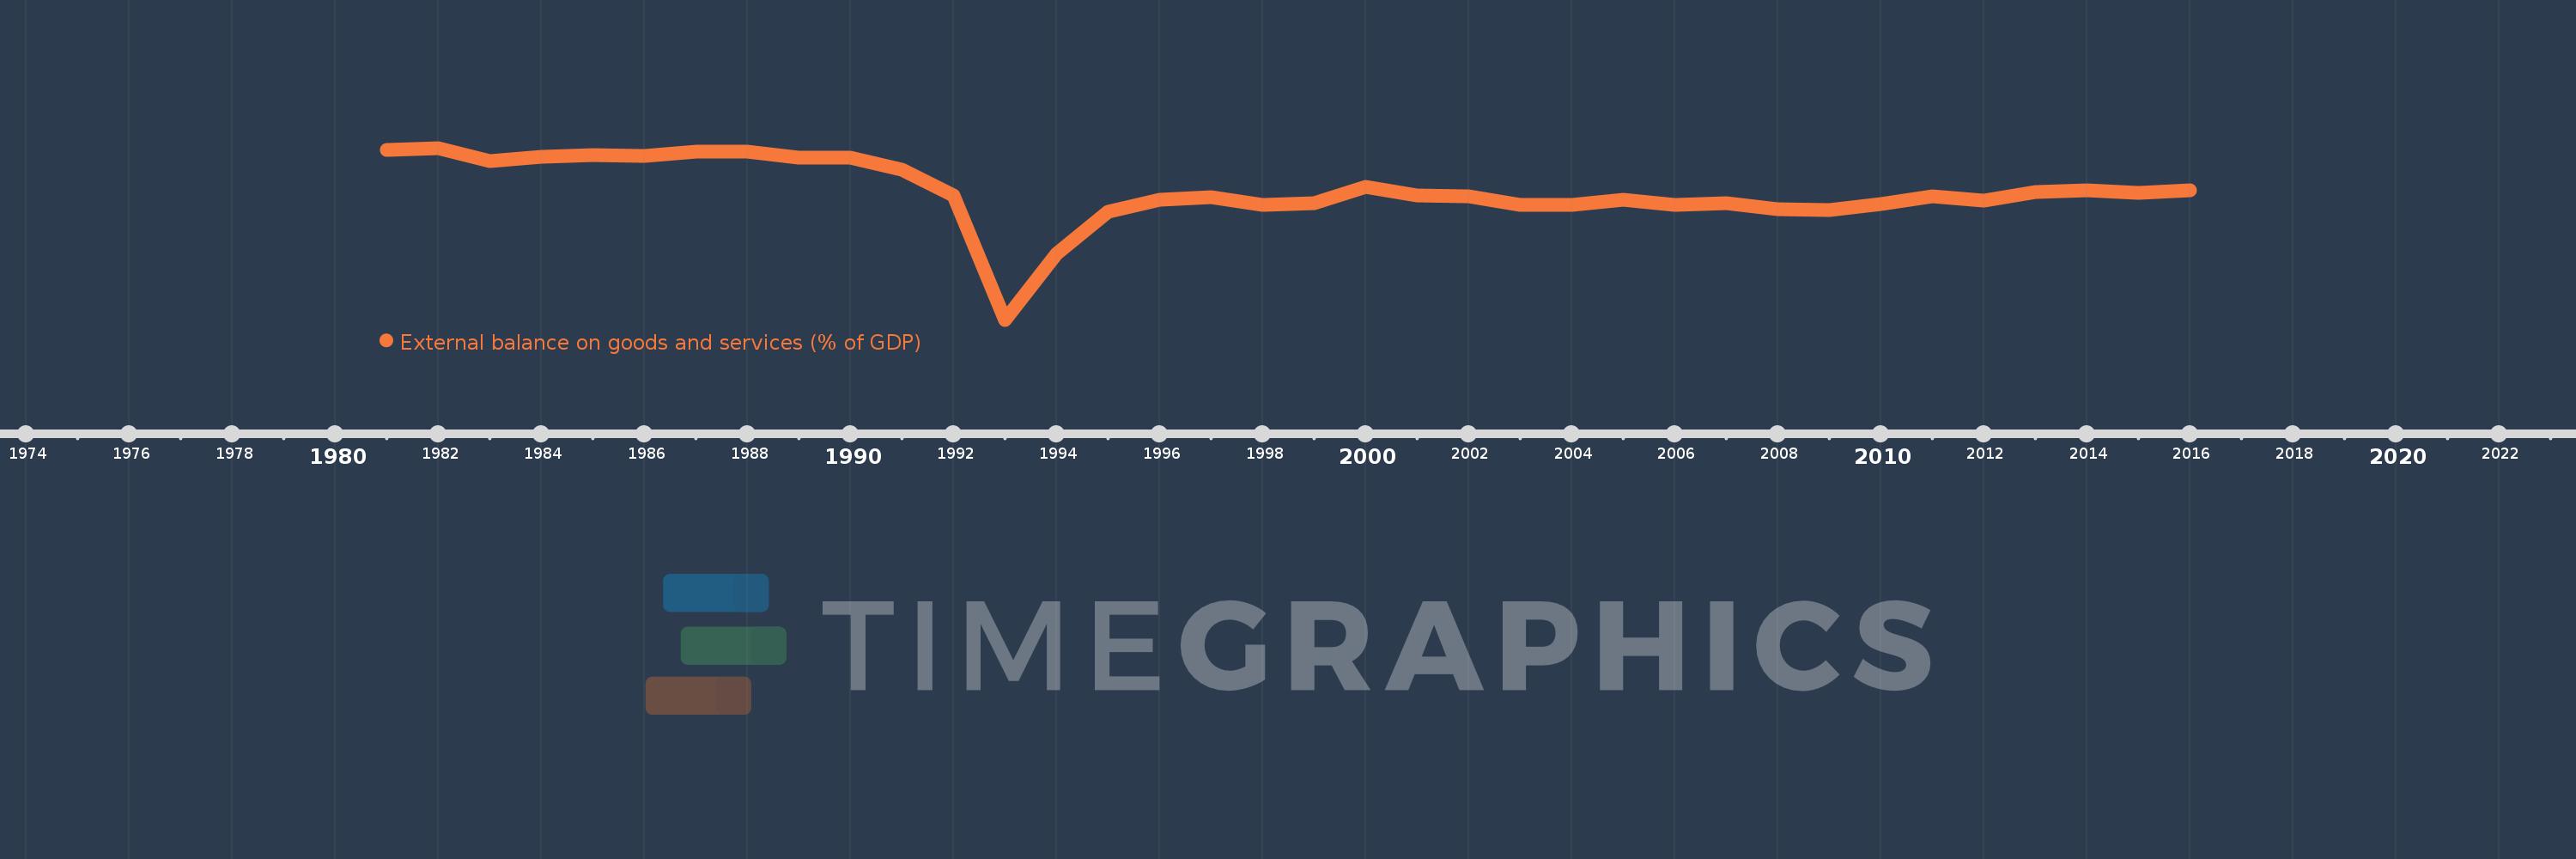
External balance on goods and services (% of GDP)
2016,2015,2014,2013,2012,2011,2010,2009,2008,2007,2006,2005,2004,2003,2002,2001,2000,1999,1998,1997,1996,1995,1994,1993,1992,1991,1990,1989,1988,1987,1986,1985,1984,1983,1982,1981
This statistics in other country:
AfghanistanAlbaniaAlgeriaAngolaAntigua and BarbudaArab WorldArgentinaArmeniaArubaAustraliaAustriaAzerbaijanBahamas, TheBahrainBangladeshBarbadosBelarusBelgiumBelizeBeninBermudaBhutanBoliviaBosnia and HerzegovinaBotswanaBrazilBrunei DarussalamBulgariaBurkina FasoBurundiCabo VerdeCambodiaCameroonCanadaCaribbean small statesCentral African RepublicCentral Europe and the BalticsChadChileChinaColombiaComorosCongo, Dem. Rep.Congo, Rep.Costa RicaCote d'IvoireCroatiaCubaCyprusCzech RepublicDenmarkDjiboutiDominicaDominican RepublicEarly-demographic dividendEast Asia & PacificEast Asia & Pacific (excluding high income)East Asia & Pacific (IDA & IBRD countries)EcuadorEgypt, Arab Rep.El SalvadorEquatorial GuineaEritreaEstoniaEthiopiaEuro areaEurope & Central AsiaEurope & Central Asia (excluding high income)Europe & Central Asia (IDA & IBRD countries)European UnionFaroe IslandsFijiFinlandFragile and conflict affected situationsFranceFrench PolynesiaGabonGambia, TheGeorgiaGermanyGhanaGreeceGrenadaGuatemalaGuineaGuinea-BissauGuyanaHaitiHeavily indebted poor countries (HIPC)High incomeHondurasHong Kong SAR, ChinaHungaryIBRD onlyIcelandIDA & IBRD totalIDA blendIDA onlyIDA totalIndiaIndonesiaIran, Islamic Rep.IraqIrelandIsraelItalyJamaicaJapanJordanKazakhstanKenyaKiribatiKorea, Rep.KosovoKuwaitKyrgyz RepublicLao PDRLate-demographic dividendLatin America & Caribbean Latin America & Caribbean (excluding high income)Latin America & the Caribbean (IDA & IBRD countries)LatviaLeast developed countries: UN classificationLebanonLesothoLiberiaLibyaLithuaniaLow & middle incomeLow incomeLower middle incomeLuxembourgMacao SAR, ChinaMacedonia, FYRMadagascarMalawiMalaysiaMaldivesMaliMaltaMauritaniaMauritiusMexicoMicronesia, Fed. Sts.Middle East & North AfricaMiddle East & North Africa (excluding high income)Middle East & North Africa (IDA & IBRD countries)Middle incomeMoldovaMongoliaMontenegroMoroccoMozambiqueMyanmarNamibiaNepalNetherlandsNew CaledoniaNew ZealandNicaraguaNigerNigeriaNorth AmericaNorwayOECD membersOmanOther small statesPacific island small statesPakistanPalauPanamaPapua New GuineaParaguayPeruPhilippinesPolandPortugalPost-demographic dividendPre-demographic dividendPuerto RicoQatarRomaniaRussian FederationRwandaSamoaSaudi ArabiaSenegalSerbiaSeychellesSierra LeoneSingaporeSlovak RepublicSloveniaSmall statesSolomon IslandsSomaliaSouth AfricaSouth AsiaSouth Asia (IDA & IBRD)South SudanSpainSri LankaSt. Kitts and NevisSt. LuciaSt. Vincent and the GrenadinesSub-Saharan Africa Sub-Saharan Africa (excluding high income)Sub-Saharan Africa (IDA & IBRD countries)SudanSurinameSwazilandSwedenSwitzerlandSyrian Arab RepublicTajikistanTanzaniaThailandTimor-LesteTogoTongaTrinidad and TobagoTunisiaTurkeyTurkmenistanUgandaUkraineUnited Arab EmiratesUnited KingdomUnited StatesUpper middle incomeUruguayUzbekistanVanuatuVenezuela, RBVietnamWest Bank and GazaWorldYemen, Rep.ZambiaZimbabwe Timeline:
This timeline shows a graph from 1981 to 2016 of Albania. No data until 1980. Number of actual observations by date: 36.
Source name:
World Development Indicators
Source organization:
World Bank national accounts data, and OECD National Accounts data files.
Categories, topics:
Economy & Growth, Trade
Last updated:
apr 23, 2017
Indicators value changes by year
Minimum:
-77.022
jan 1, 1993
At the date of observation
Value
Absolute change
Change from previous value
jan 1, 1981
0.406
+0.406
0.0%
jan 1, 1982
1.468
+1.062
261.41%
jan 1, 1983
-4.503
-5.97
-406.78%
jan 1, 1984
-2.612
+1.89
-41.98%
jan 1, 1985
-1.964
+0.648
-24.81%
jan 1, 1986
-2.214
-0.25
12.73%
jan 1, 1987
-0.41
+1.804
-81.48%
jan 1, 1988
-0.096
+0.314
-76.53%
jan 1, 1989
-2.836
-2.74
2.85K%
jan 1, 1990
-2.778
+0.058
-2.03%
jan 1, 1991
-8.327
-5.549
199.72%
jan 1, 1992
-20.367
-12.04
144.6%
jan 1, 1993
-77.022
-56.655
278.17%
jan 1, 1994
-46.87
+30.152
-39.15%
jan 1, 1995
-27.599
+19.271
-41.12%
jan 1, 1996
-22.037
+5.562
-20.15%
jan 1, 1997
-20.829
+1.208
-5.48%
jan 1, 1998
-24.444
-3.616
17.36%
jan 1, 1999
-23.793
+0.652
-2.67%
jan 1, 2000
-16.396
+7.396
-31.09%
jan 1, 2001
-20.186
-3.79
23.11%
jan 1, 2002
-20.567
-0.381
1.89%
jan 1, 2003
-24.736
-4.169
20.27%
jan 1, 2004
-24.729
+0.008
-0.03%
jan 1, 2005
-22.392
+2.337
-9.45%
jan 1, 2006
-24.647
-2.255
10.07%
jan 1, 2007
-23.587
+1.06
-4.3%
jan 1, 2008
-26.704
-3.117
13.21%
jan 1, 2009
-26.847
-0.143
0.54%
jan 1, 2010
-24.158
+2.689
-10.02%
jan 1, 2011
-20.585
+3.573
-14.79%
jan 1, 2012
-22.735
-2.151
10.45%
jan 1, 2013
-18.635
+4.1
-18.03%
jan 1, 2014
-18.031
+0.604
-3.24%
jan 1, 2015
-18.994
-0.962
5.34%
jan 1, 2016
-17.715
+1.279
-6.73%
Ranking of countries by current statistics by years


Comments: