29
/
en
AIzaSyAYiBZKx7MnpbEhh9jyipgxe19OcubqV5w
April 1, 2024
54740
Post-demographic dividend
PST
false
2
1
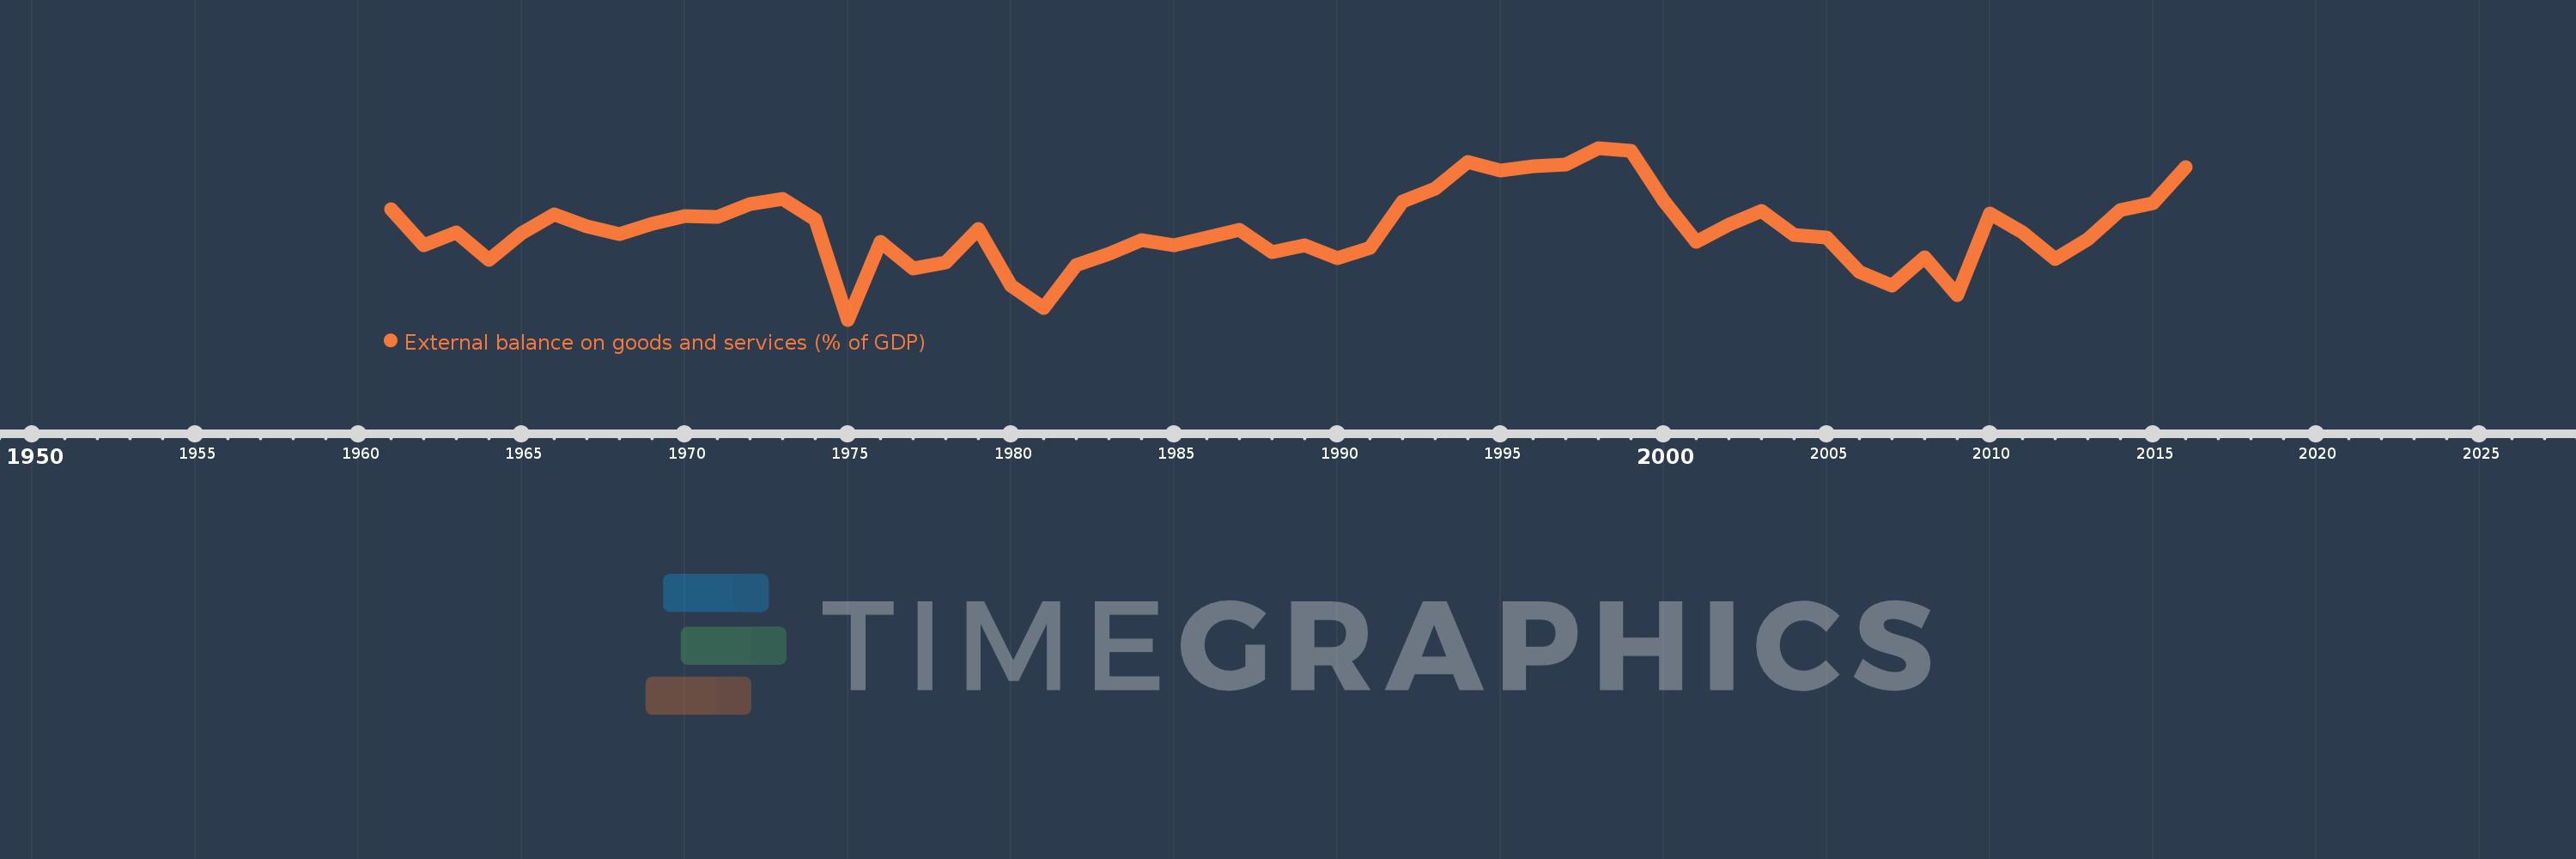
External balance on goods and services (% of GDP)
2016,2015,2014,2013,2012,2011,2010,2009,2008,2007,2006,2005,2004,2003,2002,2001,2000,1999,1998,1997,1996,1995,1994,1993,1992,1991,1990,1989,1988,1987,1986,1985,1984,1983,1982,1981,1980,1979,1978,1977,1976,1975,1974,1973,1972,1971,1970,1969,1968,1967,1966,1965,1964,1963,1962,1961
This statistics in other country:
AfghanistanAlbaniaAlgeriaAngolaAntigua and BarbudaArab WorldArgentinaArmeniaArubaAustraliaAustriaAzerbaijanBahamas, TheBahrainBangladeshBarbadosBelarusBelgiumBelizeBeninBermudaBhutanBoliviaBosnia and HerzegovinaBotswanaBrazilBrunei DarussalamBulgariaBurkina FasoBurundiCabo VerdeCambodiaCameroonCanadaCaribbean small statesCentral African RepublicCentral Europe and the BalticsChadChileChinaColombiaComorosCongo, Dem. Rep.Congo, Rep.Costa RicaCote d'IvoireCroatiaCubaCyprusCzech RepublicDenmarkDjiboutiDominicaDominican RepublicEarly-demographic dividendEast Asia & PacificEast Asia & Pacific (excluding high income)East Asia & Pacific (IDA & IBRD countries)EcuadorEgypt, Arab Rep.El SalvadorEquatorial GuineaEritreaEstoniaEthiopiaEuro areaEurope & Central AsiaEurope & Central Asia (excluding high income)Europe & Central Asia (IDA & IBRD countries)European UnionFaroe IslandsFijiFinlandFragile and conflict affected situationsFranceFrench PolynesiaGabonGambia, TheGeorgiaGermanyGhanaGreeceGrenadaGuatemalaGuineaGuinea-BissauGuyanaHaitiHeavily indebted poor countries (HIPC)High incomeHondurasHong Kong SAR, ChinaHungaryIBRD onlyIcelandIDA & IBRD totalIDA blendIDA onlyIDA totalIndiaIndonesiaIran, Islamic Rep.IraqIrelandIsraelItalyJamaicaJapanJordanKazakhstanKenyaKiribatiKorea, Rep.KosovoKuwaitKyrgyz RepublicLao PDRLate-demographic dividendLatin America & Caribbean Latin America & Caribbean (excluding high income)Latin America & the Caribbean (IDA & IBRD countries)LatviaLeast developed countries: UN classificationLebanonLesothoLiberiaLibyaLithuaniaLow & middle incomeLow incomeLower middle incomeLuxembourgMacao SAR, ChinaMacedonia, FYRMadagascarMalawiMalaysiaMaldivesMaliMaltaMauritaniaMauritiusMexicoMicronesia, Fed. Sts.Middle East & North AfricaMiddle East & North Africa (excluding high income)Middle East & North Africa (IDA & IBRD countries)Middle incomeMoldovaMongoliaMontenegroMoroccoMozambiqueMyanmarNamibiaNepalNetherlandsNew CaledoniaNew ZealandNicaraguaNigerNigeriaNorth AmericaNorwayOECD membersOmanOther small statesPacific island small statesPakistanPalauPanamaPapua New GuineaParaguayPeruPhilippinesPolandPortugalPost-demographic dividendPre-demographic dividendPuerto RicoQatarRomaniaRussian FederationRwandaSamoaSaudi ArabiaSenegalSerbiaSeychellesSierra LeoneSingaporeSlovak RepublicSloveniaSmall statesSolomon IslandsSomaliaSouth AfricaSouth AsiaSouth Asia (IDA & IBRD)South SudanSpainSri LankaSt. Kitts and NevisSt. LuciaSt. Vincent and the GrenadinesSub-Saharan Africa Sub-Saharan Africa (excluding high income)Sub-Saharan Africa (IDA & IBRD countries)SudanSurinameSwazilandSwedenSwitzerlandSyrian Arab RepublicTajikistanTanzaniaThailandTimor-LesteTogoTongaTrinidad and TobagoTunisiaTurkeyTurkmenistanUgandaUkraineUnited Arab EmiratesUnited KingdomUnited StatesUpper middle incomeUruguayUzbekistanVanuatuVenezuela, RBVietnamWest Bank and GazaWorldYemen, Rep.ZambiaZimbabwe Timeline:
This timeline shows a graph from 1961 to 2016 of Post-demographic dividend. No data until 1960. Number of actual observations by date: 56.
Source name:
World Development Indicators
Source organization:
World Bank national accounts data, and OECD National Accounts data files.
Categories, topics:
Economy & Growth, Trade
Last updated:
apr 23, 2017
Indicators value changes by year
Minimum:
-1.372
jan 1, 1975
At the date of observation
Value
Absolute change
Change from previous value
jan 1, 1961
-0.033
-0.033
0.0%
jan 1, 1962
-0.465
-0.432
1.29K%
jan 1, 1963
-0.313
+0.152
-32.74%
jan 1, 1964
-0.646
-0.333
106.5%
jan 1, 1965
-0.323
+0.323
-50.0%
jan 1, 1966
-0.096
+0.227
-70.33%
jan 1, 1967
-0.234
-0.138
144.36%
jan 1, 1968
-0.332
-0.098
41.77%
jan 1, 1969
-0.203
+0.129
-38.77%
jan 1, 1970
-0.116
+0.088
-43.12%
jan 1, 1971
-0.121
-0.005
4.21%
jan 1, 1972
0.031
+0.152
-126.08%
jan 1, 1973
0.093
+0.061
195.09%
jan 1, 1974
-0.16
-0.253
-272.56%
jan 1, 1975
-1.372
-1.211
757.09%
jan 1, 1976
-0.43
+0.942
-68.66%
jan 1, 1977
-0.748
-0.318
74.03%
jan 1, 1978
-0.678
+0.07
-9.3%
jan 1, 1979
-0.272
+0.406
-59.88%
jan 1, 1980
-0.96
-0.688
252.83%
jan 1, 1981
-1.234
-0.274
28.55%
jan 1, 1982
-0.705
+0.529
-42.85%
jan 1, 1983
-0.57
+0.135
-19.17%
jan 1, 1984
-0.405
+0.166
-29.04%
jan 1, 1985
-0.471
-0.067
16.48%
jan 1, 1986
-0.377
+0.095
-20.09%
jan 1, 1987
-0.283
+0.094
-24.91%
jan 1, 1988
-0.555
-0.272
96.08%
jan 1, 1989
-0.47
+0.084
-15.23%
jan 1, 1990
-0.624
-0.154
32.83%
jan 1, 1991
-0.494
+0.131
-20.96%
jan 1, 1992
0.069
+0.563
-114.02%
jan 1, 1993
0.219
+0.15
216.89%
jan 1, 1994
0.549
+0.33
150.24%
jan 1, 1995
0.444
-0.105
-19.18%
jan 1, 1996
0.495
+0.051
11.52%
jan 1, 1997
0.513
+0.019
3.78%
jan 1, 1998
0.714
+0.2
39.02%
jan 1, 1999
0.678
-0.035
-4.93%
jan 1, 2000
0.072
-0.606
-89.38%
jan 1, 2001
-0.423
-0.496
-687.89%
jan 1, 2002
-0.221
+0.202
-47.76%
jan 1, 2003
-0.055
+0.166
-74.98%
jan 1, 2004
-0.34
-0.285
514.01%
jan 1, 2005
-0.379
-0.039
11.6%
jan 1, 2006
-0.786
-0.407
107.24%
jan 1, 2007
-0.956
-0.17
21.62%
jan 1, 2008
-0.609
+0.347
-36.26%
jan 1, 2009
-1.07
-0.461
75.58%
jan 1, 2010
-0.087
+0.983
-91.84%
jan 1, 2011
-0.313
-0.226
258.42%
jan 1, 2012
-0.631
-0.318
101.57%
jan 1, 2013
-0.391
+0.24
-38.03%
jan 1, 2014
-0.044
+0.347
-88.72%
jan 1, 2015
0.041
+0.085
-192.88%
jan 1, 2016
0.48
+0.439
1.07K%
Ranking of countries by current statistics by years


Comments: