29
/
en
AIzaSyAYiBZKx7MnpbEhh9jyipgxe19OcubqV5w
April 1, 2024
62557
World
WLD
false
2
1
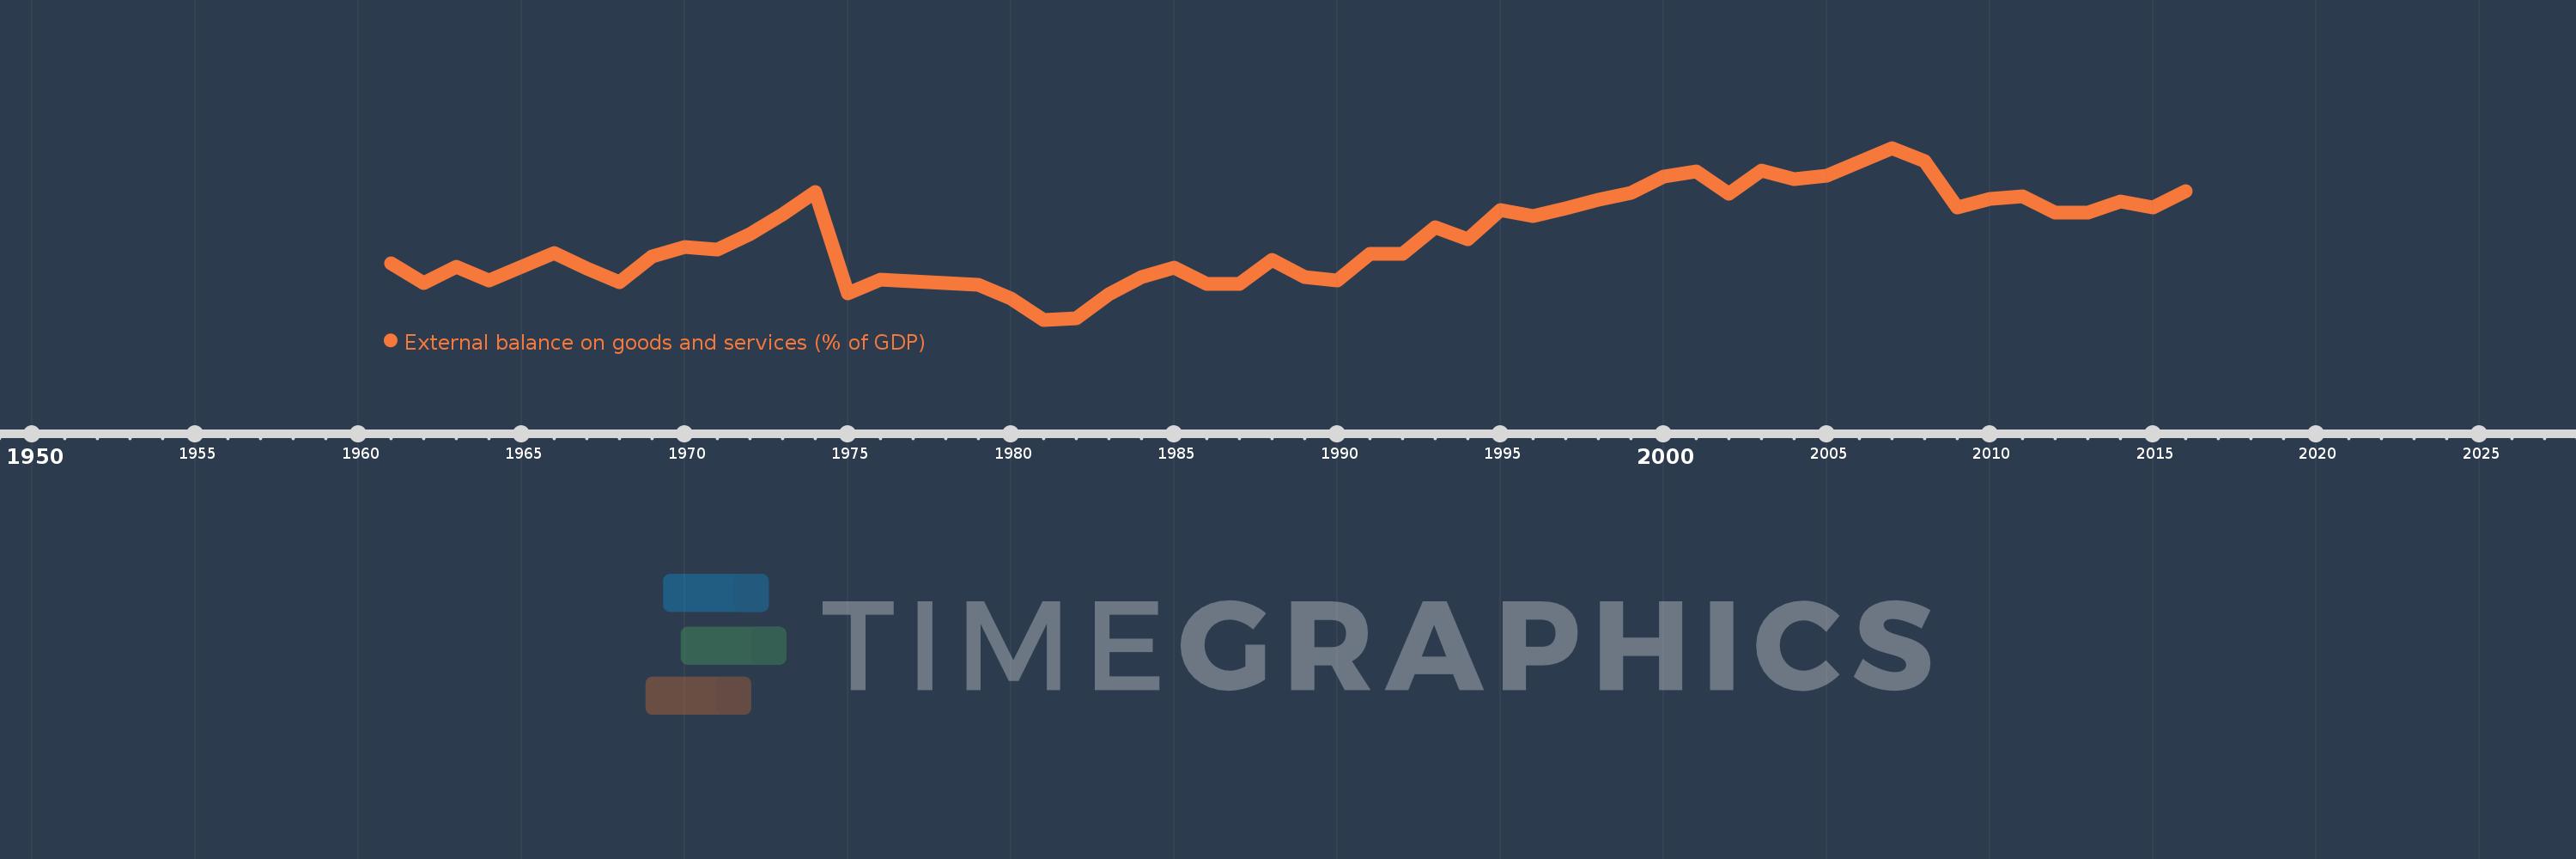
External balance on goods and services (% of GDP)
2016,2015,2014,2013,2012,2011,2010,2009,2008,2007,2006,2005,2004,2003,2002,2001,2000,1999,1998,1997,1996,1995,1994,1993,1992,1991,1990,1989,1988,1987,1986,1985,1984,1983,1982,1981,1980,1979,1978,1977,1976,1975,1974,1973,1972,1971,1970,1969,1968,1967,1966,1965,1964,1963,1962,1961
This statistics in other country:
AfghanistanAlbaniaAlgeriaAngolaAntigua and BarbudaArab WorldArgentinaArmeniaArubaAustraliaAustriaAzerbaijanBahamas, TheBahrainBangladeshBarbadosBelarusBelgiumBelizeBeninBermudaBhutanBoliviaBosnia and HerzegovinaBotswanaBrazilBrunei DarussalamBulgariaBurkina FasoBurundiCabo VerdeCambodiaCameroonCanadaCaribbean small statesCentral African RepublicCentral Europe and the BalticsChadChileChinaColombiaComorosCongo, Dem. Rep.Congo, Rep.Costa RicaCote d'IvoireCroatiaCubaCyprusCzech RepublicDenmarkDjiboutiDominicaDominican RepublicEarly-demographic dividendEast Asia & PacificEast Asia & Pacific (excluding high income)East Asia & Pacific (IDA & IBRD countries)EcuadorEgypt, Arab Rep.El SalvadorEquatorial GuineaEritreaEstoniaEthiopiaEuro areaEurope & Central AsiaEurope & Central Asia (excluding high income)Europe & Central Asia (IDA & IBRD countries)European UnionFaroe IslandsFijiFinlandFragile and conflict affected situationsFranceFrench PolynesiaGabonGambia, TheGeorgiaGermanyGhanaGreeceGrenadaGuatemalaGuineaGuinea-BissauGuyanaHaitiHeavily indebted poor countries (HIPC)High incomeHondurasHong Kong SAR, ChinaHungaryIBRD onlyIcelandIDA & IBRD totalIDA blendIDA onlyIDA totalIndiaIndonesiaIran, Islamic Rep.IraqIrelandIsraelItalyJamaicaJapanJordanKazakhstanKenyaKiribatiKorea, Rep.KosovoKuwaitKyrgyz RepublicLao PDRLate-demographic dividendLatin America & Caribbean Latin America & Caribbean (excluding high income)Latin America & the Caribbean (IDA & IBRD countries)LatviaLeast developed countries: UN classificationLebanonLesothoLiberiaLibyaLithuaniaLow & middle incomeLow incomeLower middle incomeLuxembourgMacao SAR, ChinaMacedonia, FYRMadagascarMalawiMalaysiaMaldivesMaliMaltaMauritaniaMauritiusMexicoMicronesia, Fed. Sts.Middle East & North AfricaMiddle East & North Africa (excluding high income)Middle East & North Africa (IDA & IBRD countries)Middle incomeMoldovaMongoliaMontenegroMoroccoMozambiqueMyanmarNamibiaNepalNetherlandsNew CaledoniaNew ZealandNicaraguaNigerNigeriaNorth AmericaNorwayOECD membersOmanOther small statesPacific island small statesPakistanPalauPanamaPapua New GuineaParaguayPeruPhilippinesPolandPortugalPost-demographic dividendPre-demographic dividendPuerto RicoQatarRomaniaRussian FederationRwandaSamoaSaudi ArabiaSenegalSerbiaSeychellesSierra LeoneSingaporeSlovak RepublicSloveniaSmall statesSolomon IslandsSomaliaSouth AfricaSouth AsiaSouth Asia (IDA & IBRD)South SudanSpainSri LankaSt. Kitts and NevisSt. LuciaSt. Vincent and the GrenadinesSub-Saharan Africa Sub-Saharan Africa (excluding high income)Sub-Saharan Africa (IDA & IBRD countries)SudanSurinameSwazilandSwedenSwitzerlandSyrian Arab RepublicTajikistanTanzaniaThailandTimor-LesteTogoTongaTrinidad and TobagoTunisiaTurkeyTurkmenistanUgandaUkraineUnited Arab EmiratesUnited KingdomUnited StatesUpper middle incomeUruguayUzbekistanVanuatuVenezuela, RBVietnamWest Bank and GazaWorldYemen, Rep.ZambiaZimbabwe Timeline:
This timeline shows a graph from 1961 to 2016 of World. No data until 1960. Number of actual observations by date: 56.
Source name:
World Development Indicators
Source organization:
World Bank national accounts data, and OECD National Accounts data files.
Categories, topics:
Economy & Growth, Trade
Last updated:
apr 23, 2017
Indicators value changes by year
Minimum:
-0.959
jan 1, 1981
At the date of observation
Value
Absolute change
Change from previous value
jan 1, 1961
-0.219
-0.219
0.0%
jan 1, 1962
-0.481
-0.262
119.85%
jan 1, 1963
-0.265
+0.216
-44.93%
jan 1, 1964
-0.438
-0.173
65.21%
jan 1, 1965
-0.26
+0.178
-40.61%
jan 1, 1966
-0.085
+0.175
-67.47%
jan 1, 1967
-0.29
-0.206
243.55%
jan 1, 1968
-0.468
-0.178
61.21%
jan 1, 1969
-0.131
+0.337
-71.92%
jan 1, 1970
-0.004
+0.127
-96.75%
jan 1, 1971
-0.037
-0.033
775.03%
jan 1, 1972
0.165
+0.202
-540.64%
jan 1, 1973
0.425
+0.26
158.17%
jan 1, 1974
0.724
+0.299
70.38%
jan 1, 1975
-0.617
-1.341
-185.15%
jan 1, 1976
-0.436
+0.181
-29.32%
jan 1, 1977
-0.451
-0.015
3.46%
jan 1, 1978
-0.476
-0.025
5.55%
jan 1, 1979
-0.501
-0.025
5.24%
jan 1, 1980
-0.681
-0.18
35.9%
jan 1, 1981
-0.959
-0.278
40.85%
jan 1, 1982
-0.945
+0.014
-1.41%
jan 1, 1983
-0.627
+0.318
-33.63%
jan 1, 1984
-0.394
+0.234
-37.22%
jan 1, 1985
-0.277
+0.116
-29.55%
jan 1, 1986
-0.489
-0.212
76.38%
jan 1, 1987
-0.493
-0.003
0.66%
jan 1, 1988
-0.167
+0.325
-66.06%
jan 1, 1989
-0.392
-0.225
134.44%
jan 1, 1990
-0.437
-0.045
11.51%
jan 1, 1991
-0.087
+0.35
-80.09%
jan 1, 1992
-0.089
-0.002
1.96%
jan 1, 1993
0.259
+0.348
-391.86%
jan 1, 1994
0.095
-0.164
-63.36%
jan 1, 1995
0.488
+0.393
414.06%
jan 1, 1996
0.409
-0.079
-16.18%
jan 1, 1997
0.504
+0.095
23.34%
jan 1, 1998
0.621
+0.116
23.08%
jan 1, 1999
0.715
+0.094
15.2%
jan 1, 2000
0.922
+0.207
28.9%
jan 1, 2001
0.992
+0.07
7.6%
jan 1, 2002
0.695
-0.297
-29.92%
jan 1, 2003
1.001
+0.306
44.03%
jan 1, 2004
0.896
-0.104
-10.44%
jan 1, 2005
0.937
+0.041
4.57%
jan 1, 2006
1.119
+0.182
19.37%
jan 1, 2007
1.301
+0.182
16.27%
jan 1, 2008
1.128
-0.173
-13.33%
jan 1, 2009
0.516
-0.612
-54.27%
jan 1, 2010
0.631
+0.116
22.45%
jan 1, 2011
0.669
+0.037
5.91%
jan 1, 2012
0.453
-0.216
-32.33%
jan 1, 2013
0.447
-0.006
-1.24%
jan 1, 2014
0.593
+0.146
32.61%
jan 1, 2015
0.513
-0.08
-13.46%
jan 1, 2016
0.736
+0.223
43.51%
Ranking of countries by current statistics by years


Comments: