29
/
en
AIzaSyAYiBZKx7MnpbEhh9jyipgxe19OcubqV5w
April 1, 2024
164772
Jordan
JOR
true
2
1
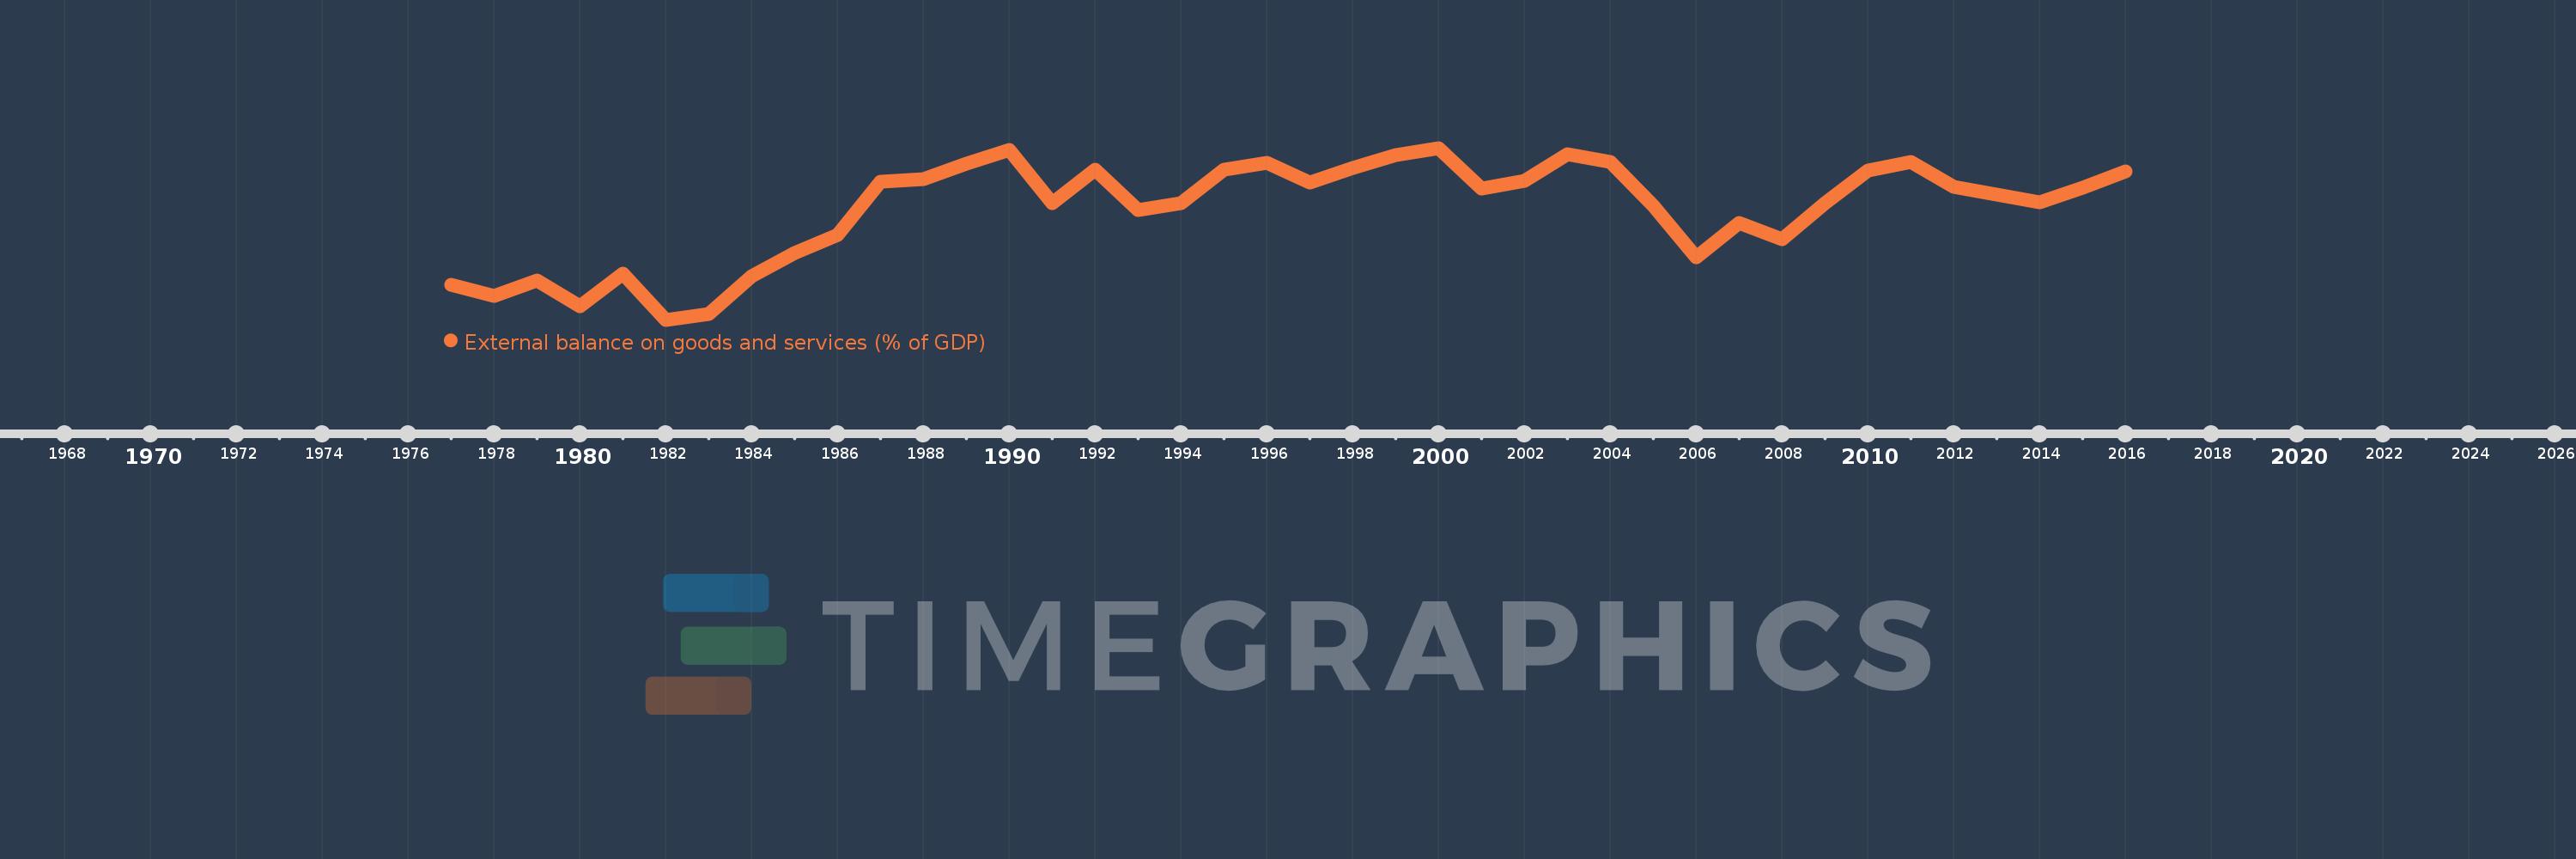
External balance on goods and services (% of GDP)
2016,2015,2014,2013,2012,2011,2010,2009,2008,2007,2006,2005,2004,2003,2002,2001,2000,1999,1998,1997,1996,1995,1994,1993,1992,1991,1990,1989,1988,1987,1986,1985,1984,1983,1982,1981,1980,1979,1978,1977
This statistics in other country:
AfghanistanAlbaniaAlgeriaAngolaAntigua and BarbudaArab WorldArgentinaArmeniaArubaAustraliaAustriaAzerbaijanBahamas, TheBahrainBangladeshBarbadosBelarusBelgiumBelizeBeninBermudaBhutanBoliviaBosnia and HerzegovinaBotswanaBrazilBrunei DarussalamBulgariaBurkina FasoBurundiCabo VerdeCambodiaCameroonCanadaCaribbean small statesCentral African RepublicCentral Europe and the BalticsChadChileChinaColombiaComorosCongo, Dem. Rep.Congo, Rep.Costa RicaCote d'IvoireCroatiaCubaCyprusCzech RepublicDenmarkDjiboutiDominicaDominican RepublicEarly-demographic dividendEast Asia & PacificEast Asia & Pacific (excluding high income)East Asia & Pacific (IDA & IBRD countries)EcuadorEgypt, Arab Rep.El SalvadorEquatorial GuineaEritreaEstoniaEthiopiaEuro areaEurope & Central AsiaEurope & Central Asia (excluding high income)Europe & Central Asia (IDA & IBRD countries)European UnionFaroe IslandsFijiFinlandFragile and conflict affected situationsFranceFrench PolynesiaGabonGambia, TheGeorgiaGermanyGhanaGreeceGrenadaGuatemalaGuineaGuinea-BissauGuyanaHaitiHeavily indebted poor countries (HIPC)High incomeHondurasHong Kong SAR, ChinaHungaryIBRD onlyIcelandIDA & IBRD totalIDA blendIDA onlyIDA totalIndiaIndonesiaIran, Islamic Rep.IraqIrelandIsraelItalyJamaicaJapanJordanKazakhstanKenyaKiribatiKorea, Rep.KosovoKuwaitKyrgyz RepublicLao PDRLate-demographic dividendLatin America & Caribbean Latin America & Caribbean (excluding high income)Latin America & the Caribbean (IDA & IBRD countries)LatviaLeast developed countries: UN classificationLebanonLesothoLiberiaLibyaLithuaniaLow & middle incomeLow incomeLower middle incomeLuxembourgMacao SAR, ChinaMacedonia, FYRMadagascarMalawiMalaysiaMaldivesMaliMaltaMauritaniaMauritiusMexicoMicronesia, Fed. Sts.Middle East & North AfricaMiddle East & North Africa (excluding high income)Middle East & North Africa (IDA & IBRD countries)Middle incomeMoldovaMongoliaMontenegroMoroccoMozambiqueMyanmarNamibiaNepalNetherlandsNew CaledoniaNew ZealandNicaraguaNigerNigeriaNorth AmericaNorwayOECD membersOmanOther small statesPacific island small statesPakistanPalauPanamaPapua New GuineaParaguayPeruPhilippinesPolandPortugalPost-demographic dividendPre-demographic dividendPuerto RicoQatarRomaniaRussian FederationRwandaSamoaSaudi ArabiaSenegalSerbiaSeychellesSierra LeoneSingaporeSlovak RepublicSloveniaSmall statesSolomon IslandsSomaliaSouth AfricaSouth AsiaSouth Asia (IDA & IBRD)South SudanSpainSri LankaSt. Kitts and NevisSt. LuciaSt. Vincent and the GrenadinesSub-Saharan Africa Sub-Saharan Africa (excluding high income)Sub-Saharan Africa (IDA & IBRD countries)SudanSurinameSwazilandSwedenSwitzerlandSyrian Arab RepublicTajikistanTanzaniaThailandTimor-LesteTogoTongaTrinidad and TobagoTunisiaTurkeyTurkmenistanUgandaUkraineUnited Arab EmiratesUnited KingdomUnited StatesUpper middle incomeUruguayUzbekistanVanuatuVenezuela, RBVietnamWest Bank and GazaWorldYemen, Rep.ZambiaZimbabwe Timeline:
This timeline shows a graph from 1977 to 2016 of Jordan. No data until 1976. Number of actual observations by date: 40.
Source name:
World Development Indicators
Source organization:
World Bank national accounts data, and OECD National Accounts data files.
Categories, topics:
Economy & Growth, Trade
Last updated:
apr 23, 2017
Indicators value changes by year
Minimum:
-54.897
jan 1, 1982
Maximum:
-17.874
jan 1, 2000
At the date of observation
Value
Absolute change
Change from previous value
jan 1, 1977
-47.382
-47.382
0.0%
jan 1, 1978
-49.783
-2.4
5.07%
jan 1, 1979
-46.367
+3.416
-6.86%
jan 1, 1980
-52.01
-5.644
12.17%
jan 1, 1981
-44.918
+7.093
-13.64%
jan 1, 1982
-54.897
-9.98
22.22%
jan 1, 1983
-53.67
+1.228
-2.24%
jan 1, 1984
-45.539
+8.131
-15.15%
jan 1, 1985
-40.467
+5.072
-11.14%
jan 1, 1986
-36.599
+3.868
-9.56%
jan 1, 1987
-25.236
+11.363
-31.05%
jan 1, 1988
-24.642
+0.594
-2.35%
jan 1, 1989
-21.234
+3.408
-13.83%
jan 1, 1990
-18.348
+2.886
-13.59%
jan 1, 1991
-29.779
-11.431
62.3%
jan 1, 1992
-22.481
+7.298
-24.51%
jan 1, 1993
-31.177
-8.696
38.68%
jan 1, 1994
-29.816
+1.361
-4.37%
jan 1, 1995
-22.606
+7.209
-24.18%
jan 1, 1996
-21.141
+1.466
-6.48%
jan 1, 1997
-25.298
-4.157
19.67%
jan 1, 1998
-22.271
+3.027
-11.97%
jan 1, 1999
-19.488
+2.783
-12.5%
jan 1, 2000
-17.874
+1.614
-8.28%
jan 1, 2001
-26.683
-8.809
49.29%
jan 1, 2002
-25.024
+1.66
-6.22%
jan 1, 2003
-19.201
+5.823
-23.27%
jan 1, 2004
-20.967
-1.767
9.2%
jan 1, 2005
-30.254
-9.287
44.29%
jan 1, 2006
-41.501
-11.247
37.18%
jan 1, 2007
-33.999
+7.502
-18.08%
jan 1, 2008
-37.524
-3.525
10.37%
jan 1, 2009
-29.713
+7.811
-20.82%
jan 1, 2010
-22.661
+7.052
-23.73%
jan 1, 2011
-20.802
+1.859
-8.21%
jan 1, 2012
-26.204
-5.402
25.97%
jan 1, 2013
-28.018
-1.814
6.92%
jan 1, 2014
-29.602
-1.584
5.65%
jan 1, 2015
-26.405
+3.197
-10.8%
jan 1, 2016
-22.902
+3.503
-13.27%
Ranking of countries by current statistics by years


Comments: