29
/
en
AIzaSyAYiBZKx7MnpbEhh9jyipgxe19OcubqV5w
April 1, 2024
255113
Swaziland
SWZ
true
2
1
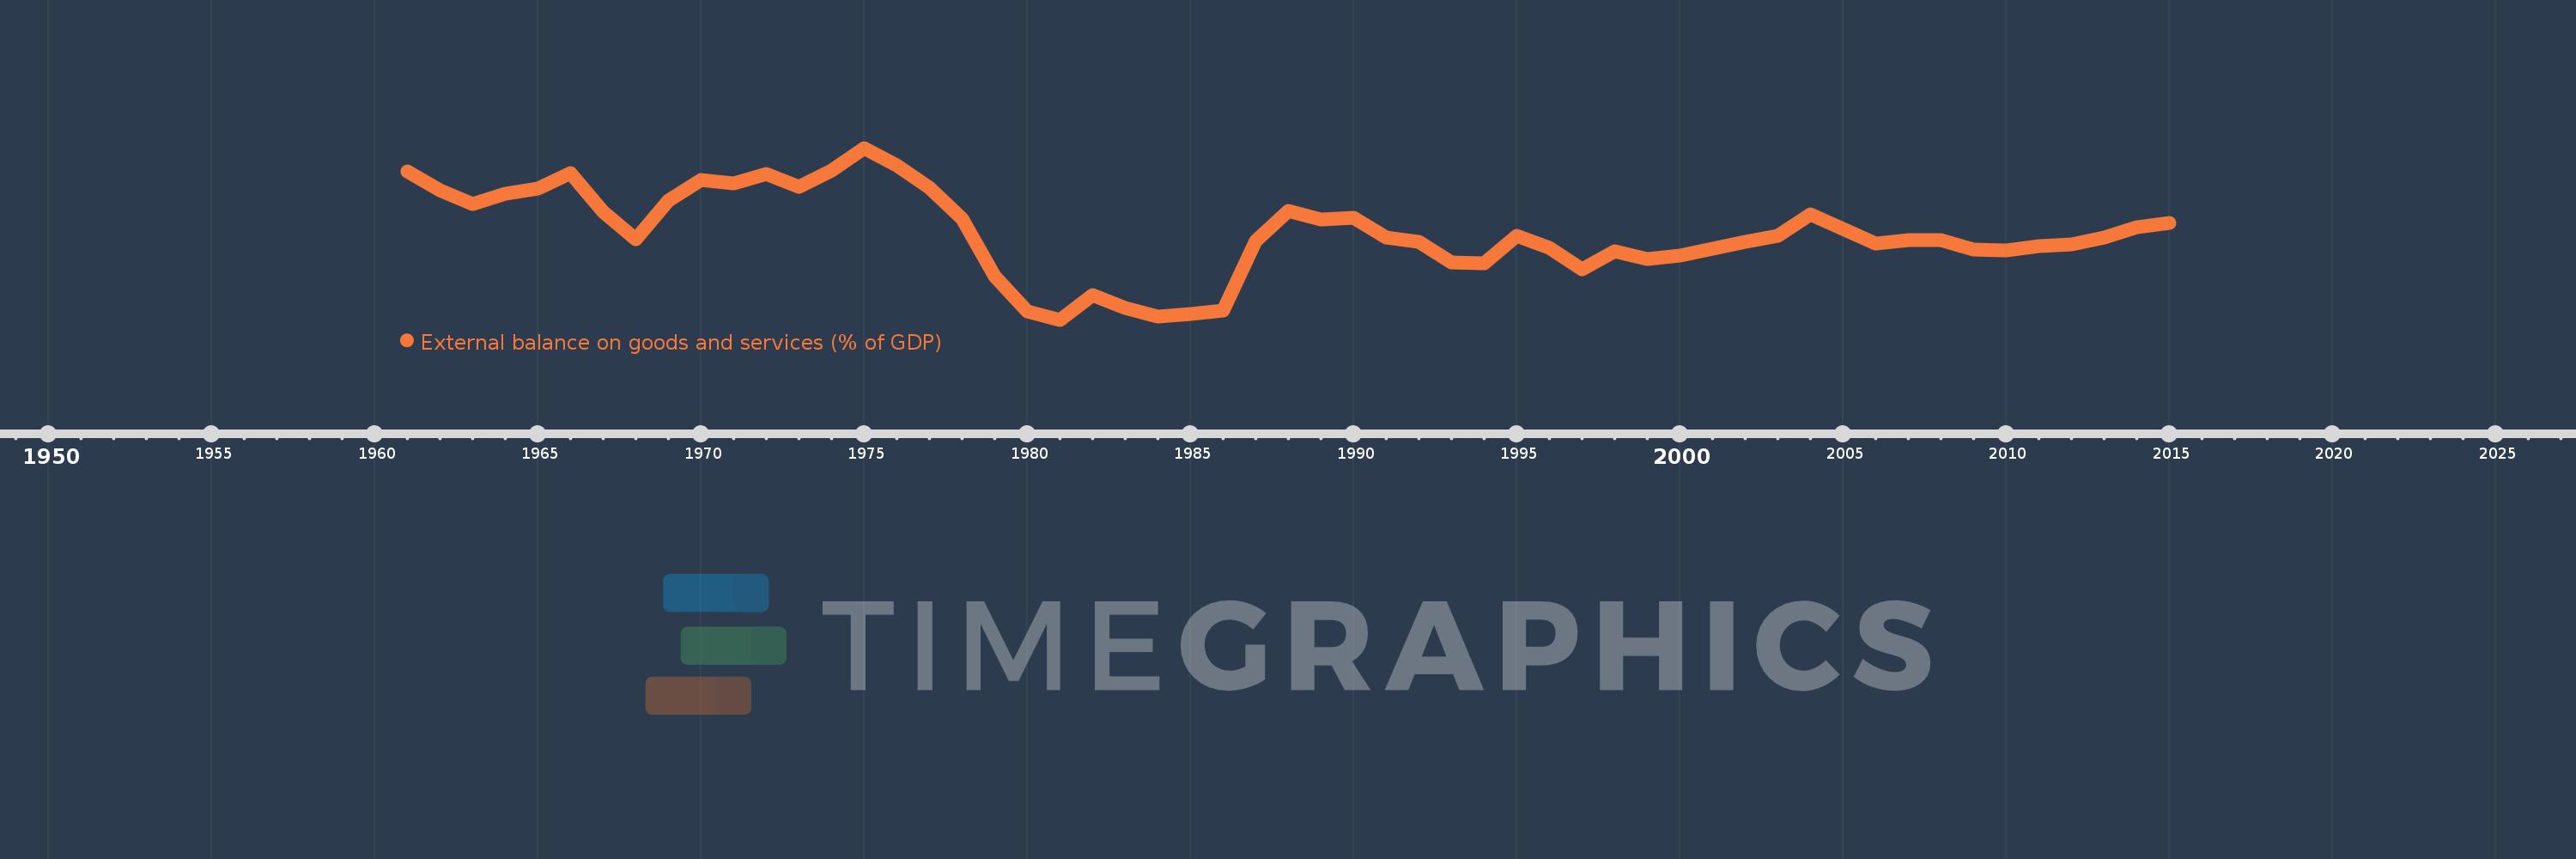
External balance on goods and services (% of GDP)
2015,2014,2013,2012,2011,2010,2009,2008,2007,2006,2005,2004,2003,2002,2001,2000,1999,1998,1997,1996,1995,1994,1993,1992,1991,1990,1989,1988,1987,1986,1985,1984,1983,1982,1981,1980,1979,1978,1977,1976,1975,1974,1973,1972,1971,1970,1969,1968,1967,1966,1965,1964,1963,1962,1961
This statistics in other country:
AfghanistanAlbaniaAlgeriaAngolaAntigua and BarbudaArab WorldArgentinaArmeniaArubaAustraliaAustriaAzerbaijanBahamas, TheBahrainBangladeshBarbadosBelarusBelgiumBelizeBeninBermudaBhutanBoliviaBosnia and HerzegovinaBotswanaBrazilBrunei DarussalamBulgariaBurkina FasoBurundiCabo VerdeCambodiaCameroonCanadaCaribbean small statesCentral African RepublicCentral Europe and the BalticsChadChileChinaColombiaComorosCongo, Dem. Rep.Congo, Rep.Costa RicaCote d'IvoireCroatiaCubaCyprusCzech RepublicDenmarkDjiboutiDominicaDominican RepublicEarly-demographic dividendEast Asia & PacificEast Asia & Pacific (excluding high income)East Asia & Pacific (IDA & IBRD countries)EcuadorEgypt, Arab Rep.El SalvadorEquatorial GuineaEritreaEstoniaEthiopiaEuro areaEurope & Central AsiaEurope & Central Asia (excluding high income)Europe & Central Asia (IDA & IBRD countries)European UnionFaroe IslandsFijiFinlandFragile and conflict affected situationsFranceFrench PolynesiaGabonGambia, TheGeorgiaGermanyGhanaGreeceGrenadaGuatemalaGuineaGuinea-BissauGuyanaHaitiHeavily indebted poor countries (HIPC)High incomeHondurasHong Kong SAR, ChinaHungaryIBRD onlyIcelandIDA & IBRD totalIDA blendIDA onlyIDA totalIndiaIndonesiaIran, Islamic Rep.IraqIrelandIsraelItalyJamaicaJapanJordanKazakhstanKenyaKiribatiKorea, Rep.KosovoKuwaitKyrgyz RepublicLao PDRLate-demographic dividendLatin America & Caribbean Latin America & Caribbean (excluding high income)Latin America & the Caribbean (IDA & IBRD countries)LatviaLeast developed countries: UN classificationLebanonLesothoLiberiaLibyaLithuaniaLow & middle incomeLow incomeLower middle incomeLuxembourgMacao SAR, ChinaMacedonia, FYRMadagascarMalawiMalaysiaMaldivesMaliMaltaMauritaniaMauritiusMexicoMicronesia, Fed. Sts.Middle East & North AfricaMiddle East & North Africa (excluding high income)Middle East & North Africa (IDA & IBRD countries)Middle incomeMoldovaMongoliaMontenegroMoroccoMozambiqueMyanmarNamibiaNepalNetherlandsNew CaledoniaNew ZealandNicaraguaNigerNigeriaNorth AmericaNorwayOECD membersOmanOther small statesPacific island small statesPakistanPalauPanamaPapua New GuineaParaguayPeruPhilippinesPolandPortugalPost-demographic dividendPre-demographic dividendPuerto RicoQatarRomaniaRussian FederationRwandaSamoaSaudi ArabiaSenegalSerbiaSeychellesSierra LeoneSingaporeSlovak RepublicSloveniaSmall statesSolomon IslandsSomaliaSouth AfricaSouth AsiaSouth Asia (IDA & IBRD)South SudanSpainSri LankaSt. Kitts and NevisSt. LuciaSt. Vincent and the GrenadinesSub-Saharan Africa Sub-Saharan Africa (excluding high income)Sub-Saharan Africa (IDA & IBRD countries)SudanSurinameSwazilandSwedenSwitzerlandSyrian Arab RepublicTajikistanTanzaniaThailandTimor-LesteTogoTongaTrinidad and TobagoTunisiaTurkeyTurkmenistanUgandaUkraineUnited Arab EmiratesUnited KingdomUnited StatesUpper middle incomeUruguayUzbekistanVanuatuVenezuela, RBVietnamWest Bank and GazaWorldYemen, Rep.ZambiaZimbabwe Timeline:
This timeline shows a graph from 1961 to 2015 of Swaziland. No data until 1960. Number of actual observations by date: 55.
Source name:
World Development Indicators
Source organization:
World Bank national accounts data, and OECD National Accounts data files.
Categories, topics:
Economy & Growth, Trade
Last updated:
apr 23, 2017
Indicators value changes by year
Minimum:
-39.445
jan 1, 1981
Maximum:
22.272
jan 1, 1975
At the date of observation
Value
Absolute change
Change from previous value
jan 1, 1961
13.969
+13.969
0.0%
jan 1, 1962
7.158
-6.811
-48.76%
jan 1, 1963
2.134
-5.025
-70.19%
jan 1, 1964
5.69
+3.556
166.67%
jan 1, 1965
7.756
+2.066
36.31%
jan 1, 1966
13.347
+5.59
72.08%
jan 1, 1967
-0.546
-13.893
-104.09%
jan 1, 1968
-10.674
-10.128
1.85K%
jan 1, 1969
3.509
+14.183
-132.87%
jan 1, 1970
10.757
+7.248
206.57%
jan 1, 1971
9.488
-1.269
-11.8%
jan 1, 1972
12.91
+3.422
36.06%
jan 1, 1973
8.422
-4.488
-34.76%
jan 1, 1974
14.221
+5.799
68.85%
jan 1, 1975
22.272
+8.051
56.61%
jan 1, 1976
16.041
-6.23
-27.97%
jan 1, 1977
8.101
-7.94
-49.5%
jan 1, 1978
-3.253
-11.354
-140.15%
jan 1, 1979
-23.734
-20.481
629.68%
jan 1, 1980
-36.322
-12.588
53.04%
jan 1, 1981
-39.445
-3.123
8.6%
jan 1, 1982
-30.645
+8.8
-22.31%
jan 1, 1983
-35.258
-4.613
15.05%
jan 1, 1984
-38.306
-3.048
8.65%
jan 1, 1985
-37.245
+1.061
-2.77%
jan 1, 1986
-36.171
+1.074
-2.88%
jan 1, 1987
-11.001
+25.17
-69.59%
jan 1, 1988
-0.261
+10.74
-97.63%
jan 1, 1989
-3.4
-3.14
1.2K%
jan 1, 1990
-2.779
+0.621
-18.27%
jan 1, 1991
-9.859
-7.08
254.74%
jan 1, 1992
-11.377
-1.518
15.4%
jan 1, 1993
-18.744
-7.366
64.75%
jan 1, 1994
-19.091
-0.348
1.85%
jan 1, 1995
-9.186
+9.905
-51.88%
jan 1, 1996
-13.732
-4.545
49.48%
jan 1, 1997
-21.278
-7.546
54.95%
jan 1, 1998
-14.801
+6.477
-30.44%
jan 1, 1999
-17.603
-2.802
18.93%
jan 1, 2000
-16.267
+1.336
-7.59%
jan 1, 2001
-13.991
+2.276
-13.99%
jan 1, 2002
-11.531
+2.459
-17.58%
jan 1, 2003
-9.348
+2.183
-18.93%
jan 1, 2004
-1.537
+7.811
-83.56%
jan 1, 2005
-6.949
-5.412
352.02%
jan 1, 2006
-12.179
-5.23
75.26%
jan 1, 2007
-10.757
+1.422
-11.67%
jan 1, 2008
-10.873
-0.116
1.08%
jan 1, 2009
-14.148
-3.275
30.12%
jan 1, 2010
-14.651
-0.503
3.56%
jan 1, 2011
-12.853
+1.797
-12.27%
jan 1, 2012
-12.349
+0.504
-3.92%
jan 1, 2013
-9.886
+2.463
-19.94%
jan 1, 2014
-6.101
+3.785
-38.29%
jan 1, 2015
-4.769
+1.332
-21.83%
Ranking of countries by current statistics by years


Comments: