29
/
en
AIzaSyAYiBZKx7MnpbEhh9jyipgxe19OcubqV5w
April 1, 2024
147888
Guyana
GUY
true
2
1
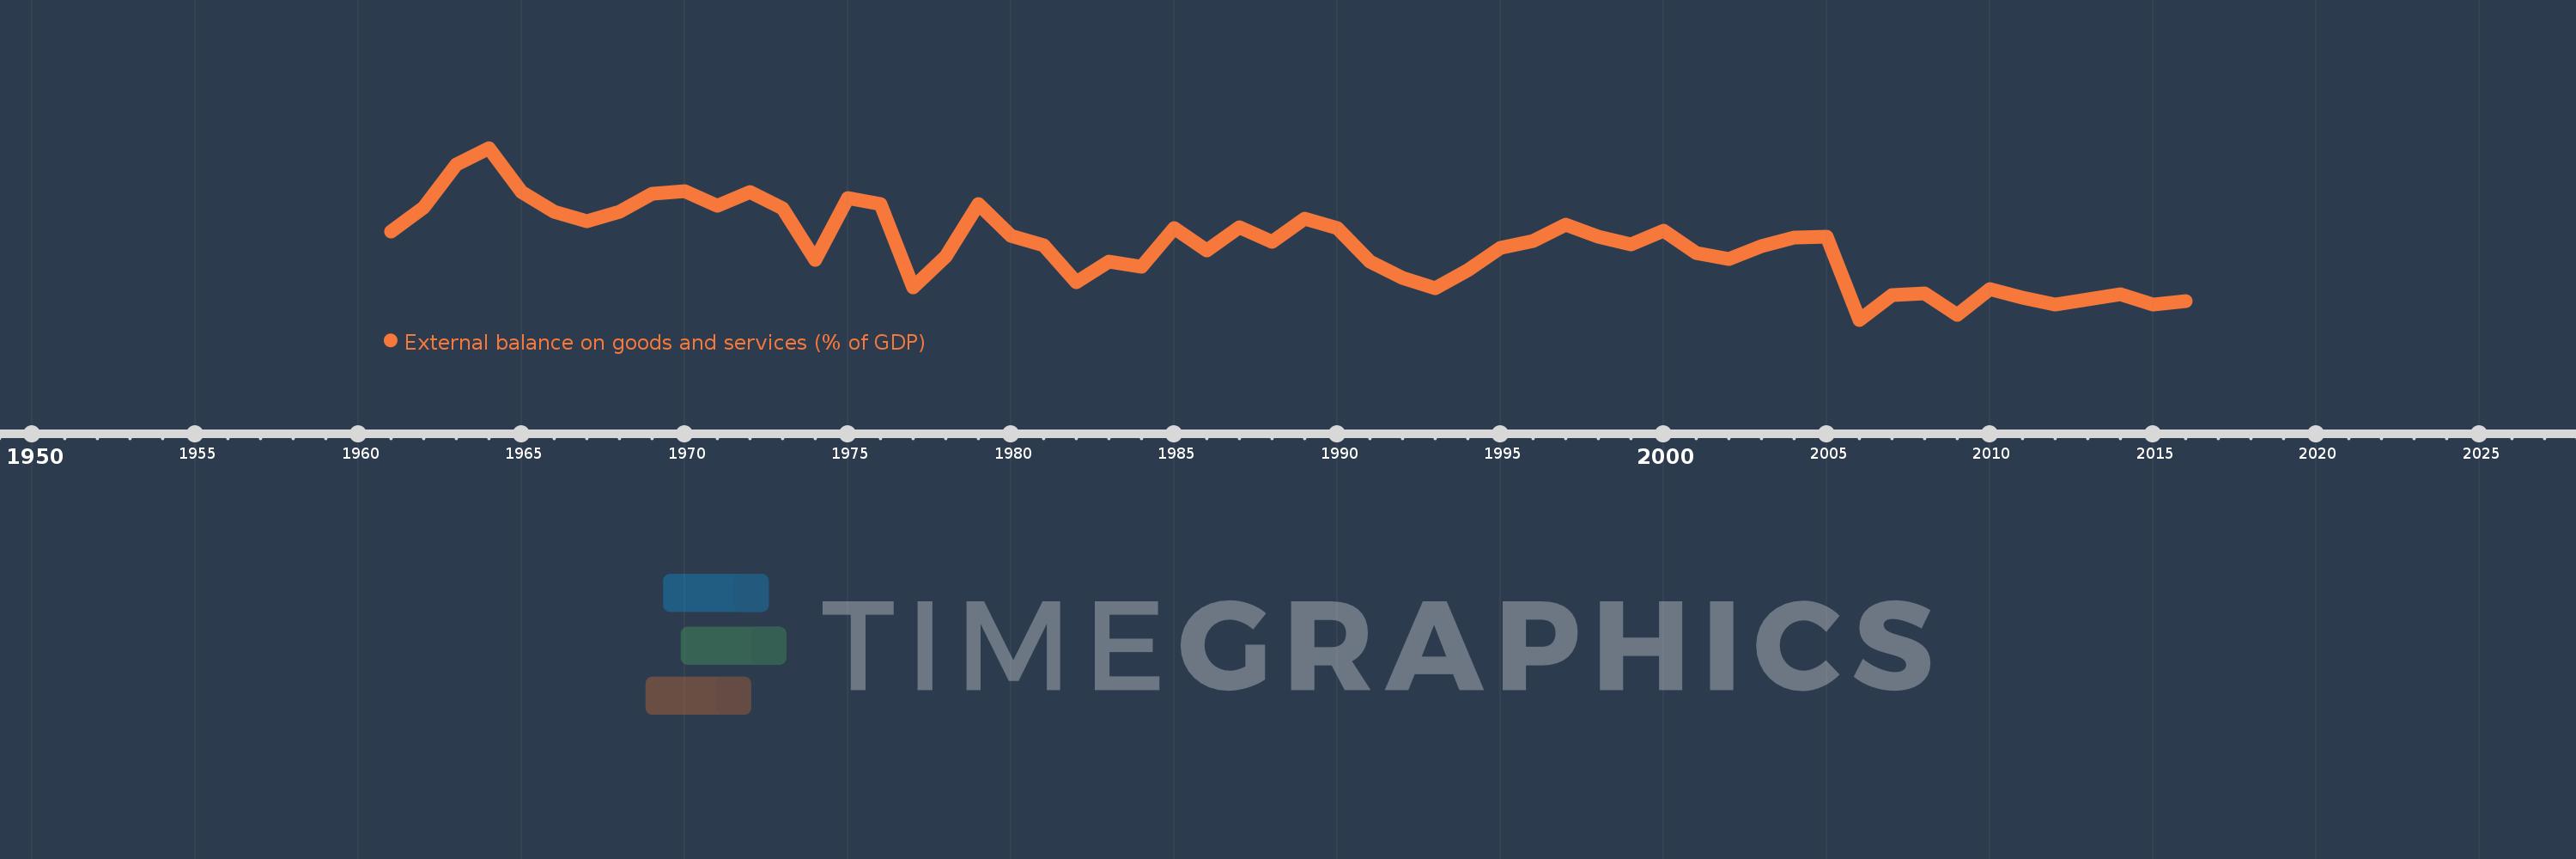
External balance on goods and services (% of GDP)
2016,2015,2014,2013,2012,2011,2010,2009,2008,2007,2006,2005,2004,2003,2002,2001,2000,1999,1998,1997,1996,1995,1994,1993,1992,1991,1990,1989,1988,1987,1986,1985,1984,1983,1982,1981,1980,1979,1978,1977,1976,1975,1974,1973,1972,1971,1970,1969,1968,1967,1966,1965,1964,1963,1962,1961
This statistics in other country:
AfghanistanAlbaniaAlgeriaAngolaAntigua and BarbudaArab WorldArgentinaArmeniaArubaAustraliaAustriaAzerbaijanBahamas, TheBahrainBangladeshBarbadosBelarusBelgiumBelizeBeninBermudaBhutanBoliviaBosnia and HerzegovinaBotswanaBrazilBrunei DarussalamBulgariaBurkina FasoBurundiCabo VerdeCambodiaCameroonCanadaCaribbean small statesCentral African RepublicCentral Europe and the BalticsChadChileChinaColombiaComorosCongo, Dem. Rep.Congo, Rep.Costa RicaCote d'IvoireCroatiaCubaCyprusCzech RepublicDenmarkDjiboutiDominicaDominican RepublicEarly-demographic dividendEast Asia & PacificEast Asia & Pacific (excluding high income)East Asia & Pacific (IDA & IBRD countries)EcuadorEgypt, Arab Rep.El SalvadorEquatorial GuineaEritreaEstoniaEthiopiaEuro areaEurope & Central AsiaEurope & Central Asia (excluding high income)Europe & Central Asia (IDA & IBRD countries)European UnionFaroe IslandsFijiFinlandFragile and conflict affected situationsFranceFrench PolynesiaGabonGambia, TheGeorgiaGermanyGhanaGreeceGrenadaGuatemalaGuineaGuinea-BissauGuyanaHaitiHeavily indebted poor countries (HIPC)High incomeHondurasHong Kong SAR, ChinaHungaryIBRD onlyIcelandIDA & IBRD totalIDA blendIDA onlyIDA totalIndiaIndonesiaIran, Islamic Rep.IraqIrelandIsraelItalyJamaicaJapanJordanKazakhstanKenyaKiribatiKorea, Rep.KosovoKuwaitKyrgyz RepublicLao PDRLate-demographic dividendLatin America & Caribbean Latin America & Caribbean (excluding high income)Latin America & the Caribbean (IDA & IBRD countries)LatviaLeast developed countries: UN classificationLebanonLesothoLiberiaLibyaLithuaniaLow & middle incomeLow incomeLower middle incomeLuxembourgMacao SAR, ChinaMacedonia, FYRMadagascarMalawiMalaysiaMaldivesMaliMaltaMauritaniaMauritiusMexicoMicronesia, Fed. Sts.Middle East & North AfricaMiddle East & North Africa (excluding high income)Middle East & North Africa (IDA & IBRD countries)Middle incomeMoldovaMongoliaMontenegroMoroccoMozambiqueMyanmarNamibiaNepalNetherlandsNew CaledoniaNew ZealandNicaraguaNigerNigeriaNorth AmericaNorwayOECD membersOmanOther small statesPacific island small statesPakistanPalauPanamaPapua New GuineaParaguayPeruPhilippinesPolandPortugalPost-demographic dividendPre-demographic dividendPuerto RicoQatarRomaniaRussian FederationRwandaSamoaSaudi ArabiaSenegalSerbiaSeychellesSierra LeoneSingaporeSlovak RepublicSloveniaSmall statesSolomon IslandsSomaliaSouth AfricaSouth AsiaSouth Asia (IDA & IBRD)South SudanSpainSri LankaSt. Kitts and NevisSt. LuciaSt. Vincent and the GrenadinesSub-Saharan Africa Sub-Saharan Africa (excluding high income)Sub-Saharan Africa (IDA & IBRD countries)SudanSurinameSwazilandSwedenSwitzerlandSyrian Arab RepublicTajikistanTanzaniaThailandTimor-LesteTogoTongaTrinidad and TobagoTunisiaTurkeyTurkmenistanUgandaUkraineUnited Arab EmiratesUnited KingdomUnited StatesUpper middle incomeUruguayUzbekistanVanuatuVenezuela, RBVietnamWest Bank and GazaWorldYemen, Rep.ZambiaZimbabwe Timeline:
This timeline shows a graph from 1961 to 2016 of Guyana. No data until 1960. Number of actual observations by date: 56.
Source name:
World Development Indicators
Source organization:
World Bank national accounts data, and OECD National Accounts data files.
Categories, topics:
Economy & Growth, Trade
Last updated:
apr 23, 2017
Indicators value changes by year
Minimum:
-34.584
jan 1, 2006
Maximum:
16.794
jan 1, 1964
At the date of observation
Value
Absolute change
Change from previous value
jan 1, 1961
-8.225
-8.225
0.0%
jan 1, 1962
-0.91
+7.315
-88.93%
jan 1, 1963
11.759
+12.67
-1.39K%
jan 1, 1964
16.794
+5.034
42.81%
jan 1, 1965
3.594
-13.2
-78.6%
jan 1, 1966
-2.4
-5.994
-166.78%
jan 1, 1967
-5.17
-2.77
115.41%
jan 1, 1968
-2.351
+2.818
-54.52%
jan 1, 1969
3.09
+5.442
-231.43%
jan 1, 1970
3.811
+0.72
23.31%
jan 1, 1971
-0.541
-4.352
-114.21%
jan 1, 1972
3.723
+4.264
-787.55%
jan 1, 1973
-1.302
-5.024
-134.96%
jan 1, 1974
-16.703
-15.401
1.18K%
jan 1, 1975
1.927
+18.63
-111.54%
jan 1, 1976
-0.025
-1.953
-101.31%
jan 1, 1977
-24.927
-24.902
98.57K%
jan 1, 1978
-15.56
+9.368
-37.58%
jan 1, 1979
-0.016
+15.544
-99.9%
jan 1, 1980
-9.419
-9.403
59.6K%
jan 1, 1981
-12.354
-2.936
31.17%
jan 1, 1982
-23.388
-11.033
89.31%
jan 1, 1983
-17.303
+6.085
-26.02%
jan 1, 1984
-18.699
-1.396
8.07%
jan 1, 1985
-7.198
+11.501
-61.51%
jan 1, 1986
-13.795
-6.597
91.65%
jan 1, 1987
-6.908
+6.887
-49.92%
jan 1, 1988
-11.194
-4.286
62.05%
jan 1, 1989
-4.302
+6.893
-61.57%
jan 1, 1990
-7.193
-2.891
67.21%
jan 1, 1991
-17.153
-9.96
138.48%
jan 1, 1992
-22.126
-4.973
28.99%
jan 1, 1993
-25.25
-3.124
14.12%
jan 1, 1994
-19.846
+5.405
-21.4%
jan 1, 1995
-12.978
+6.868
-34.61%
jan 1, 1996
-10.906
+2.072
-15.97%
jan 1, 1997
-6.095
+4.811
-44.11%
jan 1, 1998
-9.817
-3.722
61.06%
jan 1, 1999
-11.978
-2.161
22.02%
jan 1, 2000
-8.042
+3.935
-32.86%
jan 1, 2001
-14.609
-6.566
81.65%
jan 1, 2002
-16.426
-1.817
12.44%
jan 1, 2003
-12.688
+3.737
-22.75%
jan 1, 2004
-9.977
+2.711
-21.37%
jan 1, 2005
-9.864
+0.113
-1.13%
jan 1, 2006
-34.584
-24.719
250.59%
jan 1, 2007
-27.298
+7.285
-21.07%
jan 1, 2008
-26.683
+0.615
-2.25%
jan 1, 2009
-33.002
-6.319
23.68%
jan 1, 2010
-25.378
+7.624
-23.1%
jan 1, 2011
-27.893
-2.515
9.91%
jan 1, 2012
-30.117
-2.224
7.97%
jan 1, 2013
-28.37
+1.747
-5.8%
jan 1, 2014
-26.991
+1.379
-4.86%
jan 1, 2015
-29.957
-2.966
10.99%
jan 1, 2016
-29.137
+0.82
-2.74%
Ranking of countries by current statistics by years


Comments: