29
/
en
AIzaSyAYiBZKx7MnpbEhh9jyipgxe19OcubqV5w
April 1, 2024
171655
Kuwait
KWT
true
2
1
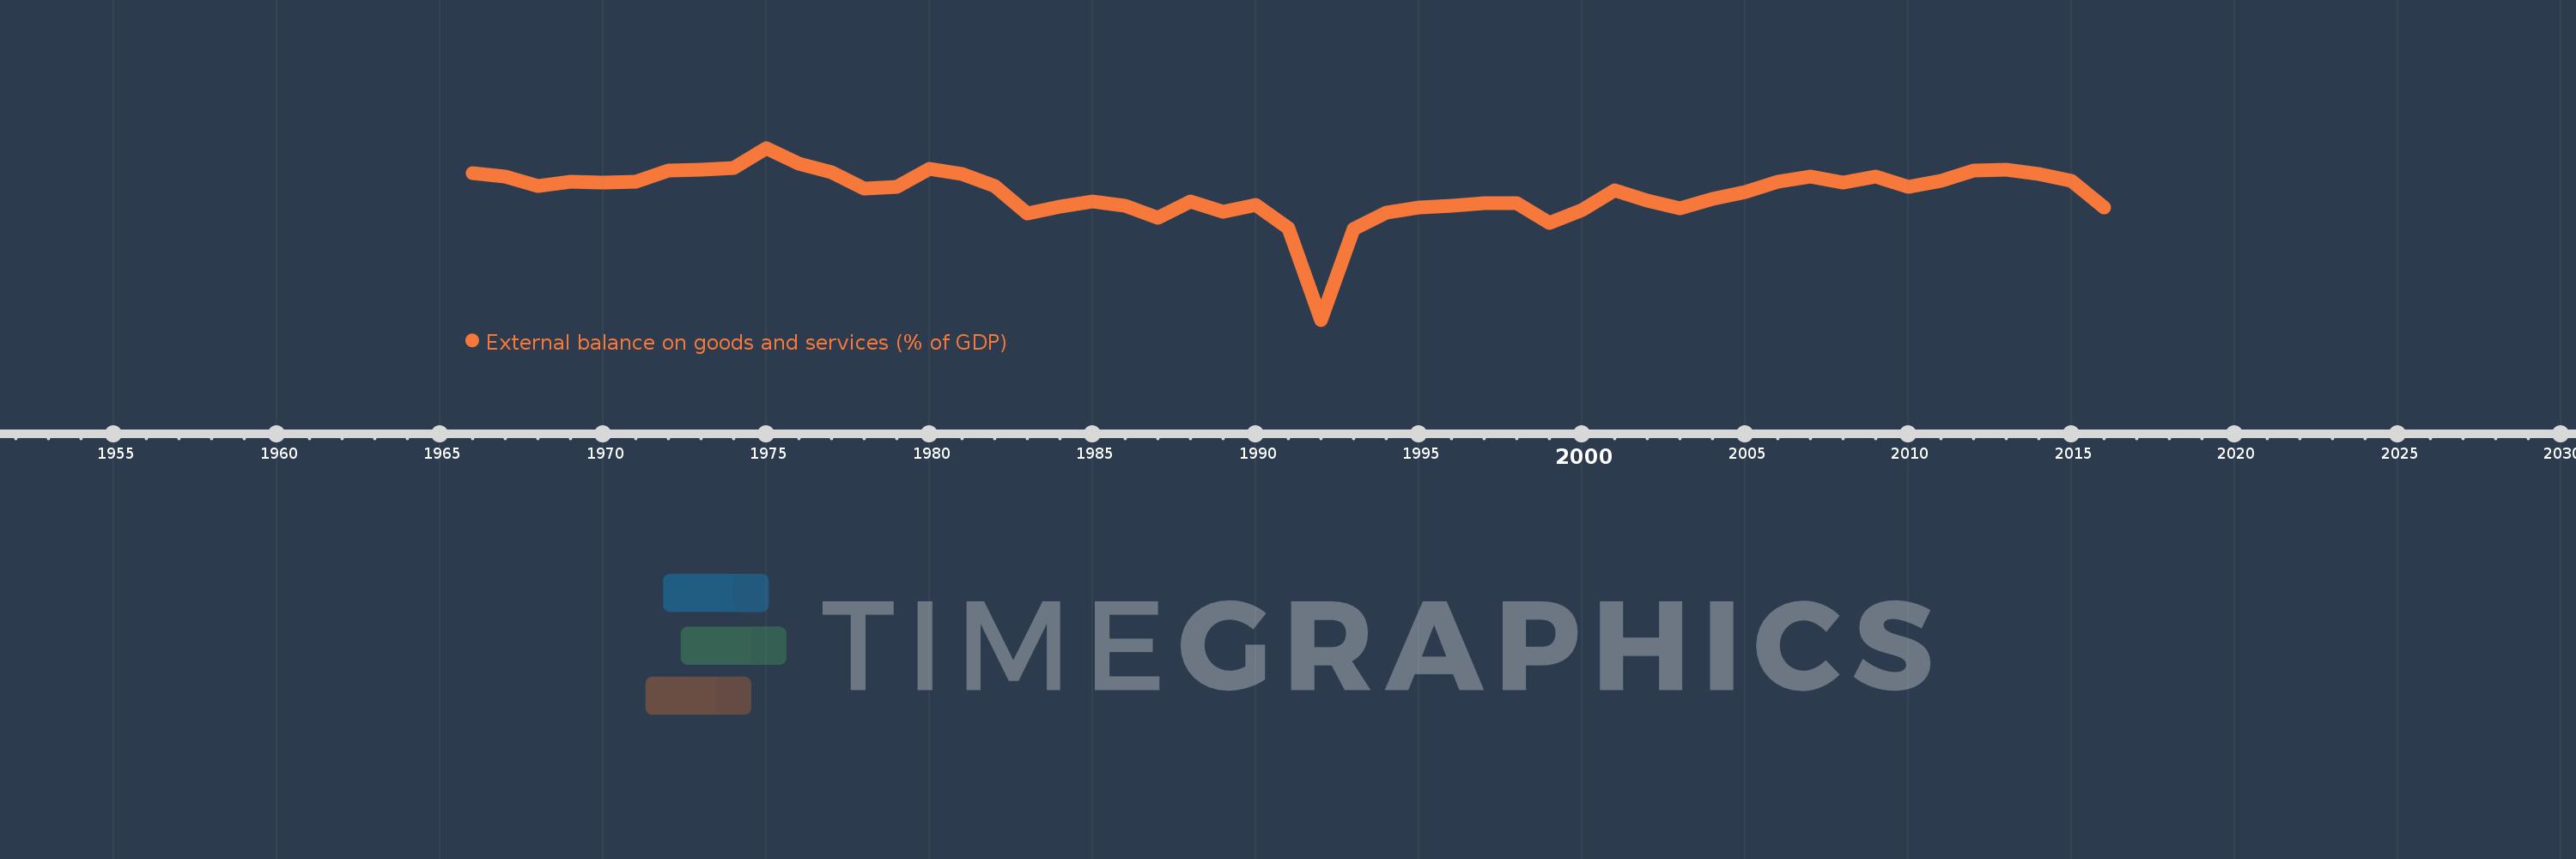
External balance on goods and services (% of GDP)
2016,2015,2014,2013,2012,2011,2010,2009,2008,2007,2006,2005,2004,2003,2002,2001,2000,1999,1998,1997,1996,1995,1994,1993,1992,1991,1990,1989,1988,1987,1986,1985,1984,1983,1982,1981,1980,1979,1978,1977,1976,1975,1974,1973,1972,1971,1970,1969,1968,1967,1966
This statistics in other country:
AfghanistanAlbaniaAlgeriaAngolaAntigua and BarbudaArab WorldArgentinaArmeniaArubaAustraliaAustriaAzerbaijanBahamas, TheBahrainBangladeshBarbadosBelarusBelgiumBelizeBeninBermudaBhutanBoliviaBosnia and HerzegovinaBotswanaBrazilBrunei DarussalamBulgariaBurkina FasoBurundiCabo VerdeCambodiaCameroonCanadaCaribbean small statesCentral African RepublicCentral Europe and the BalticsChadChileChinaColombiaComorosCongo, Dem. Rep.Congo, Rep.Costa RicaCote d'IvoireCroatiaCubaCyprusCzech RepublicDenmarkDjiboutiDominicaDominican RepublicEarly-demographic dividendEast Asia & PacificEast Asia & Pacific (excluding high income)East Asia & Pacific (IDA & IBRD countries)EcuadorEgypt, Arab Rep.El SalvadorEquatorial GuineaEritreaEstoniaEthiopiaEuro areaEurope & Central AsiaEurope & Central Asia (excluding high income)Europe & Central Asia (IDA & IBRD countries)European UnionFaroe IslandsFijiFinlandFragile and conflict affected situationsFranceFrench PolynesiaGabonGambia, TheGeorgiaGermanyGhanaGreeceGrenadaGuatemalaGuineaGuinea-BissauGuyanaHaitiHeavily indebted poor countries (HIPC)High incomeHondurasHong Kong SAR, ChinaHungaryIBRD onlyIcelandIDA & IBRD totalIDA blendIDA onlyIDA totalIndiaIndonesiaIran, Islamic Rep.IraqIrelandIsraelItalyJamaicaJapanJordanKazakhstanKenyaKiribatiKorea, Rep.KosovoKuwaitKyrgyz RepublicLao PDRLate-demographic dividendLatin America & Caribbean Latin America & Caribbean (excluding high income)Latin America & the Caribbean (IDA & IBRD countries)LatviaLeast developed countries: UN classificationLebanonLesothoLiberiaLibyaLithuaniaLow & middle incomeLow incomeLower middle incomeLuxembourgMacao SAR, ChinaMacedonia, FYRMadagascarMalawiMalaysiaMaldivesMaliMaltaMauritaniaMauritiusMexicoMicronesia, Fed. Sts.Middle East & North AfricaMiddle East & North Africa (excluding high income)Middle East & North Africa (IDA & IBRD countries)Middle incomeMoldovaMongoliaMontenegroMoroccoMozambiqueMyanmarNamibiaNepalNetherlandsNew CaledoniaNew ZealandNicaraguaNigerNigeriaNorth AmericaNorwayOECD membersOmanOther small statesPacific island small statesPakistanPalauPanamaPapua New GuineaParaguayPeruPhilippinesPolandPortugalPost-demographic dividendPre-demographic dividendPuerto RicoQatarRomaniaRussian FederationRwandaSamoaSaudi ArabiaSenegalSerbiaSeychellesSierra LeoneSingaporeSlovak RepublicSloveniaSmall statesSolomon IslandsSomaliaSouth AfricaSouth AsiaSouth Asia (IDA & IBRD)South SudanSpainSri LankaSt. Kitts and NevisSt. LuciaSt. Vincent and the GrenadinesSub-Saharan Africa Sub-Saharan Africa (excluding high income)Sub-Saharan Africa (IDA & IBRD countries)SudanSurinameSwazilandSwedenSwitzerlandSyrian Arab RepublicTajikistanTanzaniaThailandTimor-LesteTogoTongaTrinidad and TobagoTunisiaTurkeyTurkmenistanUgandaUkraineUnited Arab EmiratesUnited KingdomUnited StatesUpper middle incomeUruguayUzbekistanVanuatuVenezuela, RBVietnamWest Bank and GazaWorldYemen, Rep.ZambiaZimbabwe Timeline:
This timeline shows a graph from 1966 to 2016 of Kuwait. No data until 1965. Number of actual observations by date: 51.
Source name:
World Development Indicators
Source organization:
World Bank national accounts data, and OECD National Accounts data files.
Categories, topics:
Economy & Growth, Trade
Last updated:
apr 23, 2017
Indicators value changes by year
Minimum:
-108.809
jan 1, 1992
Maximum:
71.117
jan 1, 1975
At the date of observation
Value
Absolute change
Change from previous value
jan 1, 1966
44.593
+44.593
0.0%
jan 1, 1967
41.335
-3.258
-7.31%
jan 1, 1968
31.078
-10.257
-24.81%
jan 1, 1969
35.647
+4.569
14.7%
jan 1, 1970
34.58
-1.066
-2.99%
jan 1, 1971
35.701
+1.121
3.24%
jan 1, 1972
47.684
+11.983
33.57%
jan 1, 1973
47.937
+0.253
0.53%
jan 1, 1974
49.766
+1.829
3.82%
jan 1, 1975
71.117
+21.351
42.9%
jan 1, 1976
54.459
-16.658
-23.42%
jan 1, 1977
45.379
-9.081
-16.67%
jan 1, 1978
28.583
-16.795
-37.01%
jan 1, 1979
30.673
+2.09
7.31%
jan 1, 1980
49.153
+18.48
60.25%
jan 1, 1981
44.051
-5.102
-10.38%
jan 1, 1982
31.02
-13.031
-29.58%
jan 1, 1983
2.141
-28.879
-93.1%
jan 1, 1984
9.777
+7.636
356.68%
jan 1, 1985
15.472
+5.695
58.24%
jan 1, 1986
10.93
-4.542
-29.35%
jan 1, 1987
-1.826
-12.756
-116.71%
jan 1, 1988
15.417
+17.243
-944.34%
jan 1, 1989
4.625
-10.792
-70.0%
jan 1, 1990
11.032
+6.407
138.54%
jan 1, 1991
-13.133
-24.165
-219.05%
jan 1, 1992
-108.809
-95.676
728.51%
jan 1, 1993
-13.748
+95.061
-87.37%
jan 1, 1994
3.485
+17.233
-125.35%
jan 1, 1995
8.523
+5.038
144.54%
jan 1, 1996
10.389
+1.866
21.9%
jan 1, 1997
13.097
+2.708
26.07%
jan 1, 1998
13.262
+0.165
1.26%
jan 1, 1999
-7.234
-20.496
-154.55%
jan 1, 2000
6.5
+13.734
-189.85%
jan 1, 2001
26.327
+19.827
305.02%
jan 1, 2002
15.765
-10.562
-40.12%
jan 1, 2003
8.007
-7.758
-49.21%
jan 1, 2004
17.628
+9.621
120.16%
jan 1, 2005
24.536
+6.908
39.19%
jan 1, 2006
35.71
+11.174
45.54%
jan 1, 2007
41.378
+5.668
15.87%
jan 1, 2008
35.097
-6.281
-15.18%
jan 1, 2009
40.835
+5.738
16.35%
jan 1, 2010
30.074
-10.761
-26.35%
jan 1, 2011
36.319
+6.245
20.76%
jan 1, 2012
47.319
+11.0
30.29%
jan 1, 2013
48.452
+1.133
2.4%
jan 1, 2014
44.116
-4.336
-8.95%
jan 1, 2015
36.975
-7.141
-16.19%
jan 1, 2016
9.116
-27.86
-75.35%
Ranking of countries by current statistics by years


Comments: