29
/
en
AIzaSyAYiBZKx7MnpbEhh9jyipgxe19OcubqV5w
April 1, 2024
30640
Europe & Central Asia
ECS
false
2
1
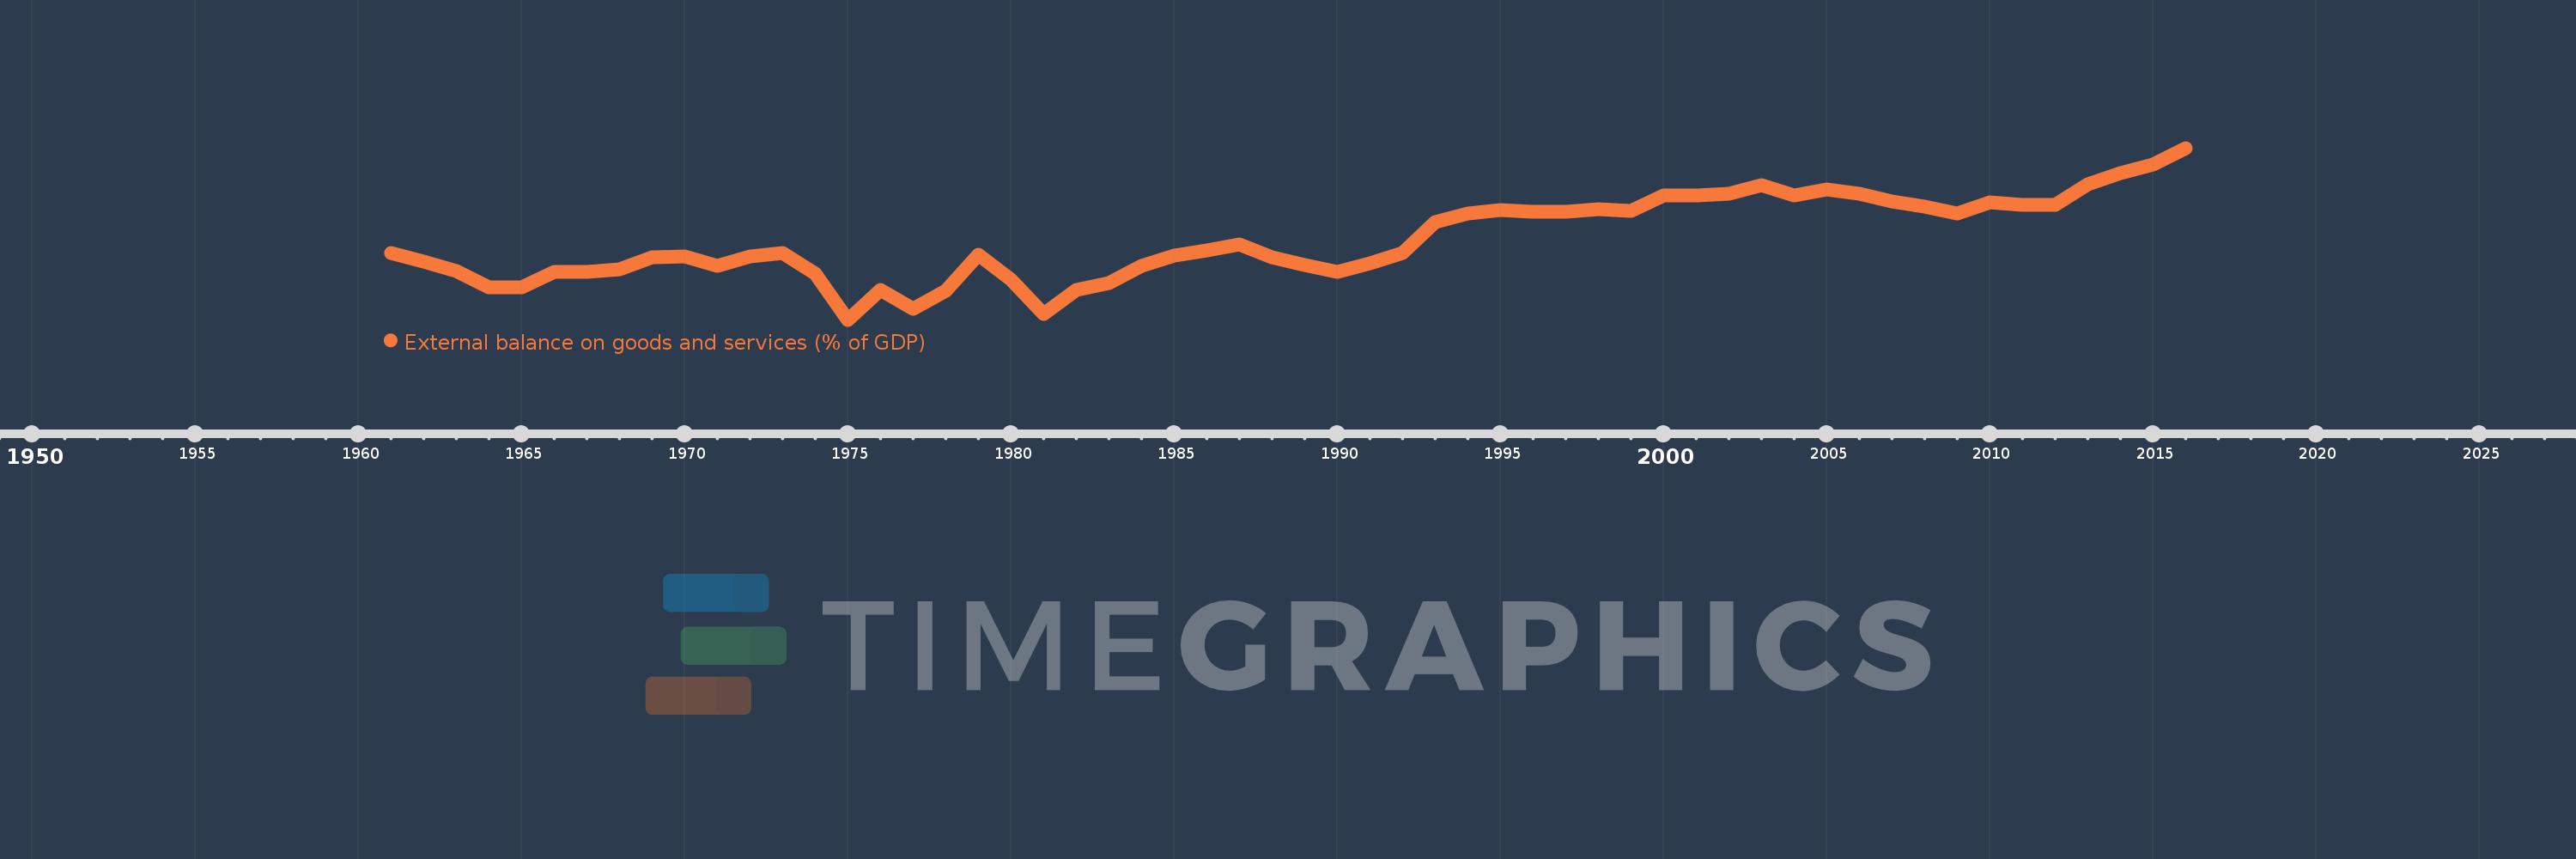
External balance on goods and services (% of GDP)
2016,2015,2014,2013,2012,2011,2010,2009,2008,2007,2006,2005,2004,2003,2002,2001,2000,1999,1998,1997,1996,1995,1994,1993,1992,1991,1990,1989,1988,1987,1986,1985,1984,1983,1982,1981,1980,1979,1978,1977,1976,1975,1974,1973,1972,1971,1970,1969,1968,1967,1966,1965,1964,1963,1962,1961
This statistics in other country:
AfghanistanAlbaniaAlgeriaAngolaAntigua and BarbudaArab WorldArgentinaArmeniaArubaAustraliaAustriaAzerbaijanBahamas, TheBahrainBangladeshBarbadosBelarusBelgiumBelizeBeninBermudaBhutanBoliviaBosnia and HerzegovinaBotswanaBrazilBrunei DarussalamBulgariaBurkina FasoBurundiCabo VerdeCambodiaCameroonCanadaCaribbean small statesCentral African RepublicCentral Europe and the BalticsChadChileChinaColombiaComorosCongo, Dem. Rep.Congo, Rep.Costa RicaCote d'IvoireCroatiaCubaCyprusCzech RepublicDenmarkDjiboutiDominicaDominican RepublicEarly-demographic dividendEast Asia & PacificEast Asia & Pacific (excluding high income)East Asia & Pacific (IDA & IBRD countries)EcuadorEgypt, Arab Rep.El SalvadorEquatorial GuineaEritreaEstoniaEthiopiaEuro areaEurope & Central AsiaEurope & Central Asia (excluding high income)Europe & Central Asia (IDA & IBRD countries)European UnionFaroe IslandsFijiFinlandFragile and conflict affected situationsFranceFrench PolynesiaGabonGambia, TheGeorgiaGermanyGhanaGreeceGrenadaGuatemalaGuineaGuinea-BissauGuyanaHaitiHeavily indebted poor countries (HIPC)High incomeHondurasHong Kong SAR, ChinaHungaryIBRD onlyIcelandIDA & IBRD totalIDA blendIDA onlyIDA totalIndiaIndonesiaIran, Islamic Rep.IraqIrelandIsraelItalyJamaicaJapanJordanKazakhstanKenyaKiribatiKorea, Rep.KosovoKuwaitKyrgyz RepublicLao PDRLate-demographic dividendLatin America & Caribbean Latin America & Caribbean (excluding high income)Latin America & the Caribbean (IDA & IBRD countries)LatviaLeast developed countries: UN classificationLebanonLesothoLiberiaLibyaLithuaniaLow & middle incomeLow incomeLower middle incomeLuxembourgMacao SAR, ChinaMacedonia, FYRMadagascarMalawiMalaysiaMaldivesMaliMaltaMauritaniaMauritiusMexicoMicronesia, Fed. Sts.Middle East & North AfricaMiddle East & North Africa (excluding high income)Middle East & North Africa (IDA & IBRD countries)Middle incomeMoldovaMongoliaMontenegroMoroccoMozambiqueMyanmarNamibiaNepalNetherlandsNew CaledoniaNew ZealandNicaraguaNigerNigeriaNorth AmericaNorwayOECD membersOmanOther small statesPacific island small statesPakistanPalauPanamaPapua New GuineaParaguayPeruPhilippinesPolandPortugalPost-demographic dividendPre-demographic dividendPuerto RicoQatarRomaniaRussian FederationRwandaSamoaSaudi ArabiaSenegalSerbiaSeychellesSierra LeoneSingaporeSlovak RepublicSloveniaSmall statesSolomon IslandsSomaliaSouth AfricaSouth AsiaSouth Asia (IDA & IBRD)South SudanSpainSri LankaSt. Kitts and NevisSt. LuciaSt. Vincent and the GrenadinesSub-Saharan Africa Sub-Saharan Africa (excluding high income)Sub-Saharan Africa (IDA & IBRD countries)SudanSurinameSwazilandSwedenSwitzerlandSyrian Arab RepublicTajikistanTanzaniaThailandTimor-LesteTogoTongaTrinidad and TobagoTunisiaTurkeyTurkmenistanUgandaUkraineUnited Arab EmiratesUnited KingdomUnited StatesUpper middle incomeUruguayUzbekistanVanuatuVenezuela, RBVietnamWest Bank and GazaWorldYemen, Rep.ZambiaZimbabwe Timeline:
This timeline shows a graph from 1961 to 2016 of Europe & Central Asia. No data until 1960. Number of actual observations by date: 56.
Source name:
World Development Indicators
Source organization:
World Bank national accounts data, and OECD National Accounts data files.
Categories, topics:
Economy & Growth, Trade
Last updated:
apr 23, 2017
Indicators value changes by year
Minimum:
-2.443
jan 1, 1975
At the date of observation
Value
Absolute change
Change from previous value
jan 1, 1961
-0.123
-0.123
0.0%
jan 1, 1962
-0.418
-0.295
240.9%
jan 1, 1963
-0.741
-0.323
77.25%
jan 1, 1964
-1.323
-0.581
78.47%
jan 1, 1965
-1.319
+0.004
-0.3%
jan 1, 1966
-0.776
+0.542
-41.11%
jan 1, 1967
-0.783
-0.007
0.88%
jan 1, 1968
-0.686
+0.098
-12.47%
jan 1, 1969
-0.284
+0.401
-58.51%
jan 1, 1970
-0.237
+0.047
-16.6%
jan 1, 1971
-0.571
-0.333
140.55%
jan 1, 1972
-0.257
+0.314
-55.0%
jan 1, 1973
-0.136
+0.121
-47.02%
jan 1, 1974
-0.826
-0.69
507.23%
jan 1, 1975
-2.443
-1.617
195.71%
jan 1, 1976
-1.409
+1.034
-42.33%
jan 1, 1977
-2.078
-0.669
47.48%
jan 1, 1978
-1.447
+0.631
-30.35%
jan 1, 1979
-0.191
+1.256
-86.82%
jan 1, 1980
-1.038
-0.847
444.24%
jan 1, 1981
-2.233
-1.195
115.13%
jan 1, 1982
-1.4
+0.834
-37.34%
jan 1, 1983
-1.174
+0.226
-16.12%
jan 1, 1984
-0.559
+0.615
-52.41%
jan 1, 1985
-0.203
+0.355
-63.58%
jan 1, 1986
-0.019
+0.185
-90.82%
jan 1, 1987
0.185
+0.204
-1.09K%
jan 1, 1988
-0.287
-0.472
-254.88%
jan 1, 1989
-0.545
-0.259
90.2%
jan 1, 1990
-0.772
-0.227
41.64%
jan 1, 1991
-0.468
+0.305
-39.43%
jan 1, 1992
-0.129
+0.339
-72.49%
jan 1, 1993
0.958
+1.087
-844.44%
jan 1, 1994
1.262
+0.304
31.75%
jan 1, 1995
1.376
+0.114
9.03%
jan 1, 1996
1.296
-0.08
-5.8%
jan 1, 1997
1.314
+0.017
1.33%
jan 1, 1998
1.389
+0.075
5.74%
jan 1, 1999
1.338
-0.051
-3.67%
jan 1, 2000
1.866
+0.528
39.46%
jan 1, 2001
1.882
+0.016
0.85%
jan 1, 2002
1.944
+0.062
3.27%
jan 1, 2003
2.244
+0.3
15.44%
jan 1, 2004
1.89
-0.354
-15.77%
jan 1, 2005
2.093
+0.203
10.74%
jan 1, 2006
1.941
-0.152
-7.26%
jan 1, 2007
1.668
-0.273
-14.06%
jan 1, 2008
1.493
-0.176
-10.52%
jan 1, 2009
1.265
-0.227
-15.24%
jan 1, 2010
1.645
+0.38
30.01%
jan 1, 2011
1.544
-0.101
-6.12%
jan 1, 2012
1.557
+0.012
0.81%
jan 1, 2013
2.258
+0.701
45.06%
jan 1, 2014
2.669
+0.411
18.19%
jan 1, 2015
2.939
+0.27
10.12%
jan 1, 2016
3.529
+0.59
20.06%
Ranking of countries by current statistics by years


Comments: