29
/
en
AIzaSyAYiBZKx7MnpbEhh9jyipgxe19OcubqV5w
April 1, 2024
187724
Malaysia
MYS
true
2
1
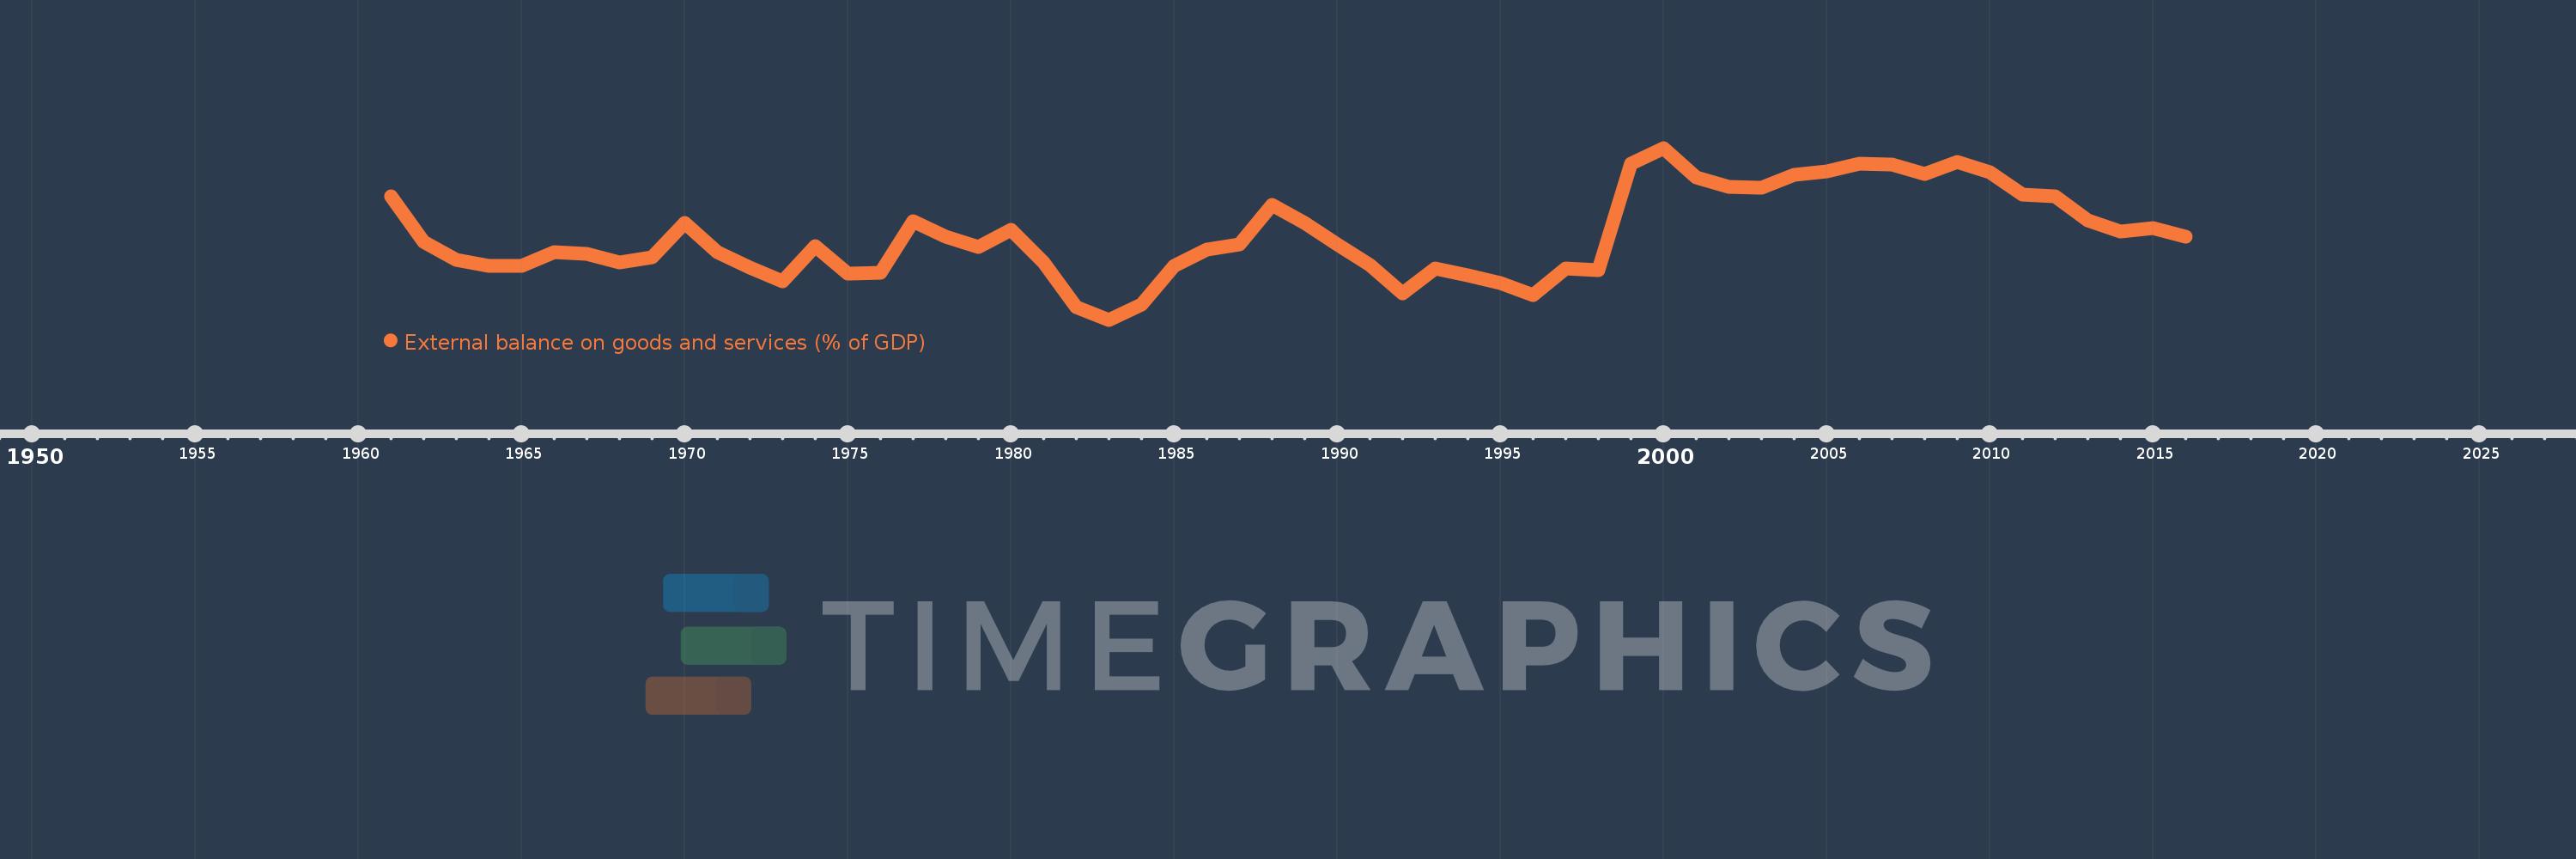
External balance on goods and services (% of GDP)
2016,2015,2014,2013,2012,2011,2010,2009,2008,2007,2006,2005,2004,2003,2002,2001,2000,1999,1998,1997,1996,1995,1994,1993,1992,1991,1990,1989,1988,1987,1986,1985,1984,1983,1982,1981,1980,1979,1978,1977,1976,1975,1974,1973,1972,1971,1970,1969,1968,1967,1966,1965,1964,1963,1962,1961
This statistics in other country:
AfghanistanAlbaniaAlgeriaAngolaAntigua and BarbudaArab WorldArgentinaArmeniaArubaAustraliaAustriaAzerbaijanBahamas, TheBahrainBangladeshBarbadosBelarusBelgiumBelizeBeninBermudaBhutanBoliviaBosnia and HerzegovinaBotswanaBrazilBrunei DarussalamBulgariaBurkina FasoBurundiCabo VerdeCambodiaCameroonCanadaCaribbean small statesCentral African RepublicCentral Europe and the BalticsChadChileChinaColombiaComorosCongo, Dem. Rep.Congo, Rep.Costa RicaCote d'IvoireCroatiaCubaCyprusCzech RepublicDenmarkDjiboutiDominicaDominican RepublicEarly-demographic dividendEast Asia & PacificEast Asia & Pacific (excluding high income)East Asia & Pacific (IDA & IBRD countries)EcuadorEgypt, Arab Rep.El SalvadorEquatorial GuineaEritreaEstoniaEthiopiaEuro areaEurope & Central AsiaEurope & Central Asia (excluding high income)Europe & Central Asia (IDA & IBRD countries)European UnionFaroe IslandsFijiFinlandFragile and conflict affected situationsFranceFrench PolynesiaGabonGambia, TheGeorgiaGermanyGhanaGreeceGrenadaGuatemalaGuineaGuinea-BissauGuyanaHaitiHeavily indebted poor countries (HIPC)High incomeHondurasHong Kong SAR, ChinaHungaryIBRD onlyIcelandIDA & IBRD totalIDA blendIDA onlyIDA totalIndiaIndonesiaIran, Islamic Rep.IraqIrelandIsraelItalyJamaicaJapanJordanKazakhstanKenyaKiribatiKorea, Rep.KosovoKuwaitKyrgyz RepublicLao PDRLate-demographic dividendLatin America & Caribbean Latin America & Caribbean (excluding high income)Latin America & the Caribbean (IDA & IBRD countries)LatviaLeast developed countries: UN classificationLebanonLesothoLiberiaLibyaLithuaniaLow & middle incomeLow incomeLower middle incomeLuxembourgMacao SAR, ChinaMacedonia, FYRMadagascarMalawiMalaysiaMaldivesMaliMaltaMauritaniaMauritiusMexicoMicronesia, Fed. Sts.Middle East & North AfricaMiddle East & North Africa (excluding high income)Middle East & North Africa (IDA & IBRD countries)Middle incomeMoldovaMongoliaMontenegroMoroccoMozambiqueMyanmarNamibiaNepalNetherlandsNew CaledoniaNew ZealandNicaraguaNigerNigeriaNorth AmericaNorwayOECD membersOmanOther small statesPacific island small statesPakistanPalauPanamaPapua New GuineaParaguayPeruPhilippinesPolandPortugalPost-demographic dividendPre-demographic dividendPuerto RicoQatarRomaniaRussian FederationRwandaSamoaSaudi ArabiaSenegalSerbiaSeychellesSierra LeoneSingaporeSlovak RepublicSloveniaSmall statesSolomon IslandsSomaliaSouth AfricaSouth AsiaSouth Asia (IDA & IBRD)South SudanSpainSri LankaSt. Kitts and NevisSt. LuciaSt. Vincent and the GrenadinesSub-Saharan Africa Sub-Saharan Africa (excluding high income)Sub-Saharan Africa (IDA & IBRD countries)SudanSurinameSwazilandSwedenSwitzerlandSyrian Arab RepublicTajikistanTanzaniaThailandTimor-LesteTogoTongaTrinidad and TobagoTunisiaTurkeyTurkmenistanUgandaUkraineUnited Arab EmiratesUnited KingdomUnited StatesUpper middle incomeUruguayUzbekistanVanuatuVenezuela, RBVietnamWest Bank and GazaWorldYemen, Rep.ZambiaZimbabwe Timeline:
This timeline shows a graph from 1961 to 2016 of Malaysia. No data until 1960. Number of actual observations by date: 56.
Source name:
World Development Indicators
Source organization:
World Bank national accounts data, and OECD National Accounts data files.
Categories, topics:
Economy & Growth, Trade
Last updated:
apr 23, 2017
Indicators value changes by year
Minimum:
-8.793
jan 1, 1983
Maximum:
25.052
jan 1, 2000
At the date of observation
Value
Absolute change
Change from previous value
jan 1, 1961
15.484
+15.484
0.0%
jan 1, 1962
6.639
-8.845
-57.12%
jan 1, 1963
3.047
-3.592
-54.1%
jan 1, 1964
1.788
-1.259
-41.31%
jan 1, 1965
1.788
-0.001
-0.03%
jan 1, 1966
4.542
+2.754
154.04%
jan 1, 1967
4.187
-0.355
-7.81%
jan 1, 1968
2.524
-1.663
-39.71%
jan 1, 1969
3.576
+1.051
41.65%
jan 1, 1970
10.242
+6.666
186.43%
jan 1, 1971
4.534
-5.707
-55.73%
jan 1, 1972
1.491
-3.044
-67.13%
jan 1, 1973
-1.303
-2.794
-187.43%
jan 1, 1974
5.706
+7.009
-537.87%
jan 1, 1975
0.299
-5.407
-94.75%
jan 1, 1976
0.512
+0.213
71.11%
jan 1, 1977
10.55
+10.038
1.96K%
jan 1, 1978
7.596
-2.954
-28.0%
jan 1, 1979
5.543
-2.053
-27.03%
jan 1, 1980
8.861
+3.318
59.86%
jan 1, 1981
2.461
-6.399
-72.22%
jan 1, 1982
-6.256
-8.717
-354.2%
jan 1, 1983
-8.793
-2.537
40.55%
jan 1, 1984
-5.744
+3.049
-34.68%
jan 1, 1985
1.867
+7.611
-132.51%
jan 1, 1986
5.104
+3.237
173.31%
jan 1, 1987
6.07
+0.966
18.92%
jan 1, 1988
13.869
+7.8
128.5%
jan 1, 1989
10.207
-3.663
-26.41%
jan 1, 1990
6.065
-4.142
-40.58%
jan 1, 1991
2.044
-4.021
-66.3%
jan 1, 1992
-3.66
-5.704
-279.08%
jan 1, 1993
1.357
+5.017
-137.06%
jan 1, 1994
-0.1
-1.456
-107.36%
jan 1, 1995
-1.603
-1.504
1.51K%
jan 1, 1996
-3.935
-2.331
145.41%
jan 1, 1997
1.386
+5.321
-135.23%
jan 1, 1998
0.914
-0.472
-34.05%
jan 1, 1999
21.995
+21.081
2.31K%
jan 1, 2000
25.052
+3.057
13.9%
jan 1, 2001
19.213
-5.839
-23.31%
jan 1, 2002
17.44
-1.772
-9.22%
jan 1, 2003
17.255
-0.186
-1.06%
jan 1, 2004
19.692
+2.437
14.12%
jan 1, 2005
20.372
+0.681
3.46%
jan 1, 2006
21.943
+1.571
7.71%
jan 1, 2007
21.794
-0.15
-0.68%
jan 1, 2008
19.871
-1.923
-8.82%
jan 1, 2009
22.331
+2.46
12.38%
jan 1, 2010
20.275
-2.056
-9.21%
jan 1, 2011
15.916
-4.359
-21.5%
jan 1, 2012
15.573
-0.343
-2.15%
jan 1, 2013
10.758
-4.815
-30.92%
jan 1, 2014
8.537
-2.221
-20.65%
jan 1, 2015
9.275
+0.738
8.64%
jan 1, 2016
7.654
-1.621
-17.48%
Ranking of countries by current statistics by years


Comments: