29
/
en
AIzaSyAYiBZKx7MnpbEhh9jyipgxe19OcubqV5w
April 1, 2024
81700
Belgium
BEL
true
2
1
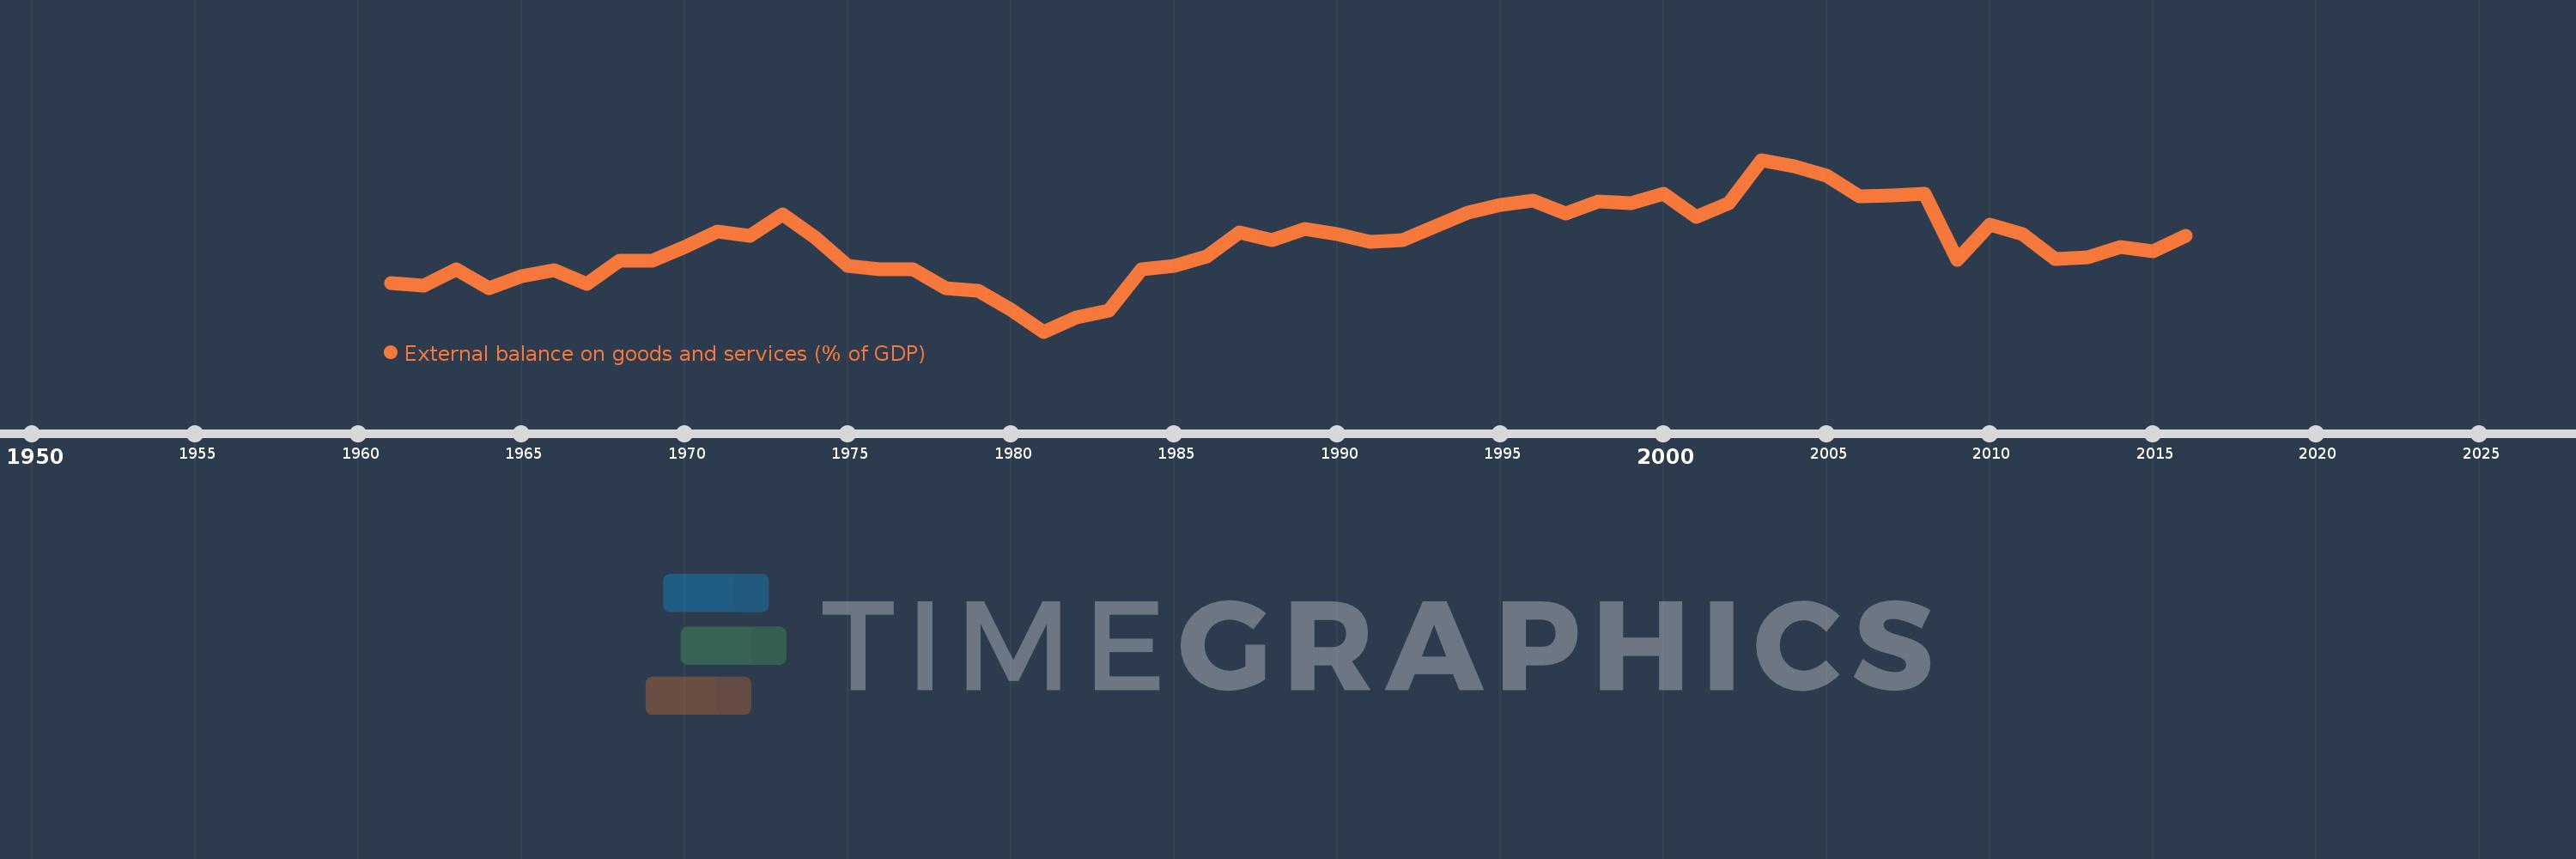
External balance on goods and services (% of GDP)
2016,2015,2014,2013,2012,2011,2010,2009,2008,2007,2006,2005,2004,2003,2002,2001,2000,1999,1998,1997,1996,1995,1994,1993,1992,1991,1990,1989,1988,1987,1986,1985,1984,1983,1982,1981,1980,1979,1978,1977,1976,1975,1974,1973,1972,1971,1970,1969,1968,1967,1966,1965,1964,1963,1962,1961
This statistics in other country:
AfghanistanAlbaniaAlgeriaAngolaAntigua and BarbudaArab WorldArgentinaArmeniaArubaAustraliaAustriaAzerbaijanBahamas, TheBahrainBangladeshBarbadosBelarusBelgiumBelizeBeninBermudaBhutanBoliviaBosnia and HerzegovinaBotswanaBrazilBrunei DarussalamBulgariaBurkina FasoBurundiCabo VerdeCambodiaCameroonCanadaCaribbean small statesCentral African RepublicCentral Europe and the BalticsChadChileChinaColombiaComorosCongo, Dem. Rep.Congo, Rep.Costa RicaCote d'IvoireCroatiaCubaCyprusCzech RepublicDenmarkDjiboutiDominicaDominican RepublicEarly-demographic dividendEast Asia & PacificEast Asia & Pacific (excluding high income)East Asia & Pacific (IDA & IBRD countries)EcuadorEgypt, Arab Rep.El SalvadorEquatorial GuineaEritreaEstoniaEthiopiaEuro areaEurope & Central AsiaEurope & Central Asia (excluding high income)Europe & Central Asia (IDA & IBRD countries)European UnionFaroe IslandsFijiFinlandFragile and conflict affected situationsFranceFrench PolynesiaGabonGambia, TheGeorgiaGermanyGhanaGreeceGrenadaGuatemalaGuineaGuinea-BissauGuyanaHaitiHeavily indebted poor countries (HIPC)High incomeHondurasHong Kong SAR, ChinaHungaryIBRD onlyIcelandIDA & IBRD totalIDA blendIDA onlyIDA totalIndiaIndonesiaIran, Islamic Rep.IraqIrelandIsraelItalyJamaicaJapanJordanKazakhstanKenyaKiribatiKorea, Rep.KosovoKuwaitKyrgyz RepublicLao PDRLate-demographic dividendLatin America & Caribbean Latin America & Caribbean (excluding high income)Latin America & the Caribbean (IDA & IBRD countries)LatviaLeast developed countries: UN classificationLebanonLesothoLiberiaLibyaLithuaniaLow & middle incomeLow incomeLower middle incomeLuxembourgMacao SAR, ChinaMacedonia, FYRMadagascarMalawiMalaysiaMaldivesMaliMaltaMauritaniaMauritiusMexicoMicronesia, Fed. Sts.Middle East & North AfricaMiddle East & North Africa (excluding high income)Middle East & North Africa (IDA & IBRD countries)Middle incomeMoldovaMongoliaMontenegroMoroccoMozambiqueMyanmarNamibiaNepalNetherlandsNew CaledoniaNew ZealandNicaraguaNigerNigeriaNorth AmericaNorwayOECD membersOmanOther small statesPacific island small statesPakistanPalauPanamaPapua New GuineaParaguayPeruPhilippinesPolandPortugalPost-demographic dividendPre-demographic dividendPuerto RicoQatarRomaniaRussian FederationRwandaSamoaSaudi ArabiaSenegalSerbiaSeychellesSierra LeoneSingaporeSlovak RepublicSloveniaSmall statesSolomon IslandsSomaliaSouth AfricaSouth AsiaSouth Asia (IDA & IBRD)South SudanSpainSri LankaSt. Kitts and NevisSt. LuciaSt. Vincent and the GrenadinesSub-Saharan Africa Sub-Saharan Africa (excluding high income)Sub-Saharan Africa (IDA & IBRD countries)SudanSurinameSwazilandSwedenSwitzerlandSyrian Arab RepublicTajikistanTanzaniaThailandTimor-LesteTogoTongaTrinidad and TobagoTunisiaTurkeyTurkmenistanUgandaUkraineUnited Arab EmiratesUnited KingdomUnited StatesUpper middle incomeUruguayUzbekistanVanuatuVenezuela, RBVietnamWest Bank and GazaWorldYemen, Rep.ZambiaZimbabwe Timeline:
This timeline shows a graph from 1961 to 2016 of Belgium. No data until 1960. Number of actual observations by date: 56.
Source name:
World Development Indicators
Source organization:
World Bank national accounts data, and OECD National Accounts data files.
Categories, topics:
Economy & Growth, Trade
Last updated:
apr 23, 2017
Indicators value changes by year
Minimum:
-3.117
jan 1, 1981
At the date of observation
Value
Absolute change
Change from previous value
jan 1, 1961
-0.7
-0.7
0.0%
jan 1, 1962
-0.792
-0.092
13.16%
jan 1, 1963
-0.011
+0.781
-98.55%
jan 1, 1964
-0.958
-0.946
8.25K%
jan 1, 1965
-0.332
+0.626
-65.35%
jan 1, 1966
-0.024
+0.308
-92.91%
jan 1, 1967
-0.704
-0.68
2.89K%
jan 1, 1968
0.419
+1.123
-159.58%
jan 1, 1969
0.461
+0.042
10.04%
jan 1, 1970
1.109
+0.648
140.49%
jan 1, 1971
1.899
+0.79
71.23%
jan 1, 1972
1.673
-0.226
-11.9%
jan 1, 1973
2.776
+1.102
65.87%
jan 1, 1974
1.616
-1.159
-41.77%
jan 1, 1975
0.188
-1.428
-88.36%
jan 1, 1976
0.025
-0.164
-86.93%
jan 1, 1977
-0.007
-0.031
-128.04%
jan 1, 1978
-0.952
-0.946
13.71K%
jan 1, 1979
-1.067
-0.115
12.08%
jan 1, 1980
-2.028
-0.96
89.97%
jan 1, 1981
-3.117
-1.089
53.72%
jan 1, 1982
-2.418
+0.699
-22.43%
jan 1, 1983
-2.069
+0.349
-14.44%
jan 1, 1984
0.023
+2.091
-101.09%
jan 1, 1985
0.195
+0.173
767.1%
jan 1, 1986
0.643
+0.448
229.39%
jan 1, 1987
1.877
+1.234
191.89%
jan 1, 1988
1.465
-0.412
-21.96%
jan 1, 1989
2.018
+0.553
37.72%
jan 1, 1990
1.796
-0.221
-10.97%
jan 1, 1991
1.373
-0.423
-23.56%
jan 1, 1992
1.491
+0.118
8.57%
jan 1, 1993
2.176
+0.685
45.97%
jan 1, 1994
2.844
+0.668
30.7%
jan 1, 1995
3.243
+0.399
14.02%
jan 1, 1996
3.464
+0.221
6.82%
jan 1, 1997
2.825
-0.638
-18.43%
jan 1, 1998
3.427
+0.601
21.28%
jan 1, 1999
3.31
-0.117
-3.41%
jan 1, 2000
3.8
+0.49
14.81%
jan 1, 2001
2.636
-1.164
-30.63%
jan 1, 2002
3.346
+0.71
26.94%
jan 1, 2003
5.505
+2.158
64.5%
jan 1, 2004
5.202
-0.303
-5.5%
jan 1, 2005
4.702
-0.5
-9.61%
jan 1, 2006
3.666
-1.036
-22.03%
jan 1, 2007
3.728
+0.062
1.7%
jan 1, 2008
3.818
+0.09
2.41%
jan 1, 2009
0.484
-3.334
-87.33%
jan 1, 2010
2.263
+1.779
367.6%
jan 1, 2011
1.797
-0.466
-20.6%
jan 1, 2012
0.517
-1.279
-71.2%
jan 1, 2013
0.617
+0.099
19.19%
jan 1, 2014
1.142
+0.525
85.15%
jan 1, 2015
0.916
-0.225
-19.74%
jan 1, 2016
1.67
+0.753
82.22%
Ranking of countries by current statistics by years


Comments: