29
/
en
AIzaSyAYiBZKx7MnpbEhh9jyipgxe19OcubqV5w
April 1, 2024
205209
Namibia
NAM
true
2
1
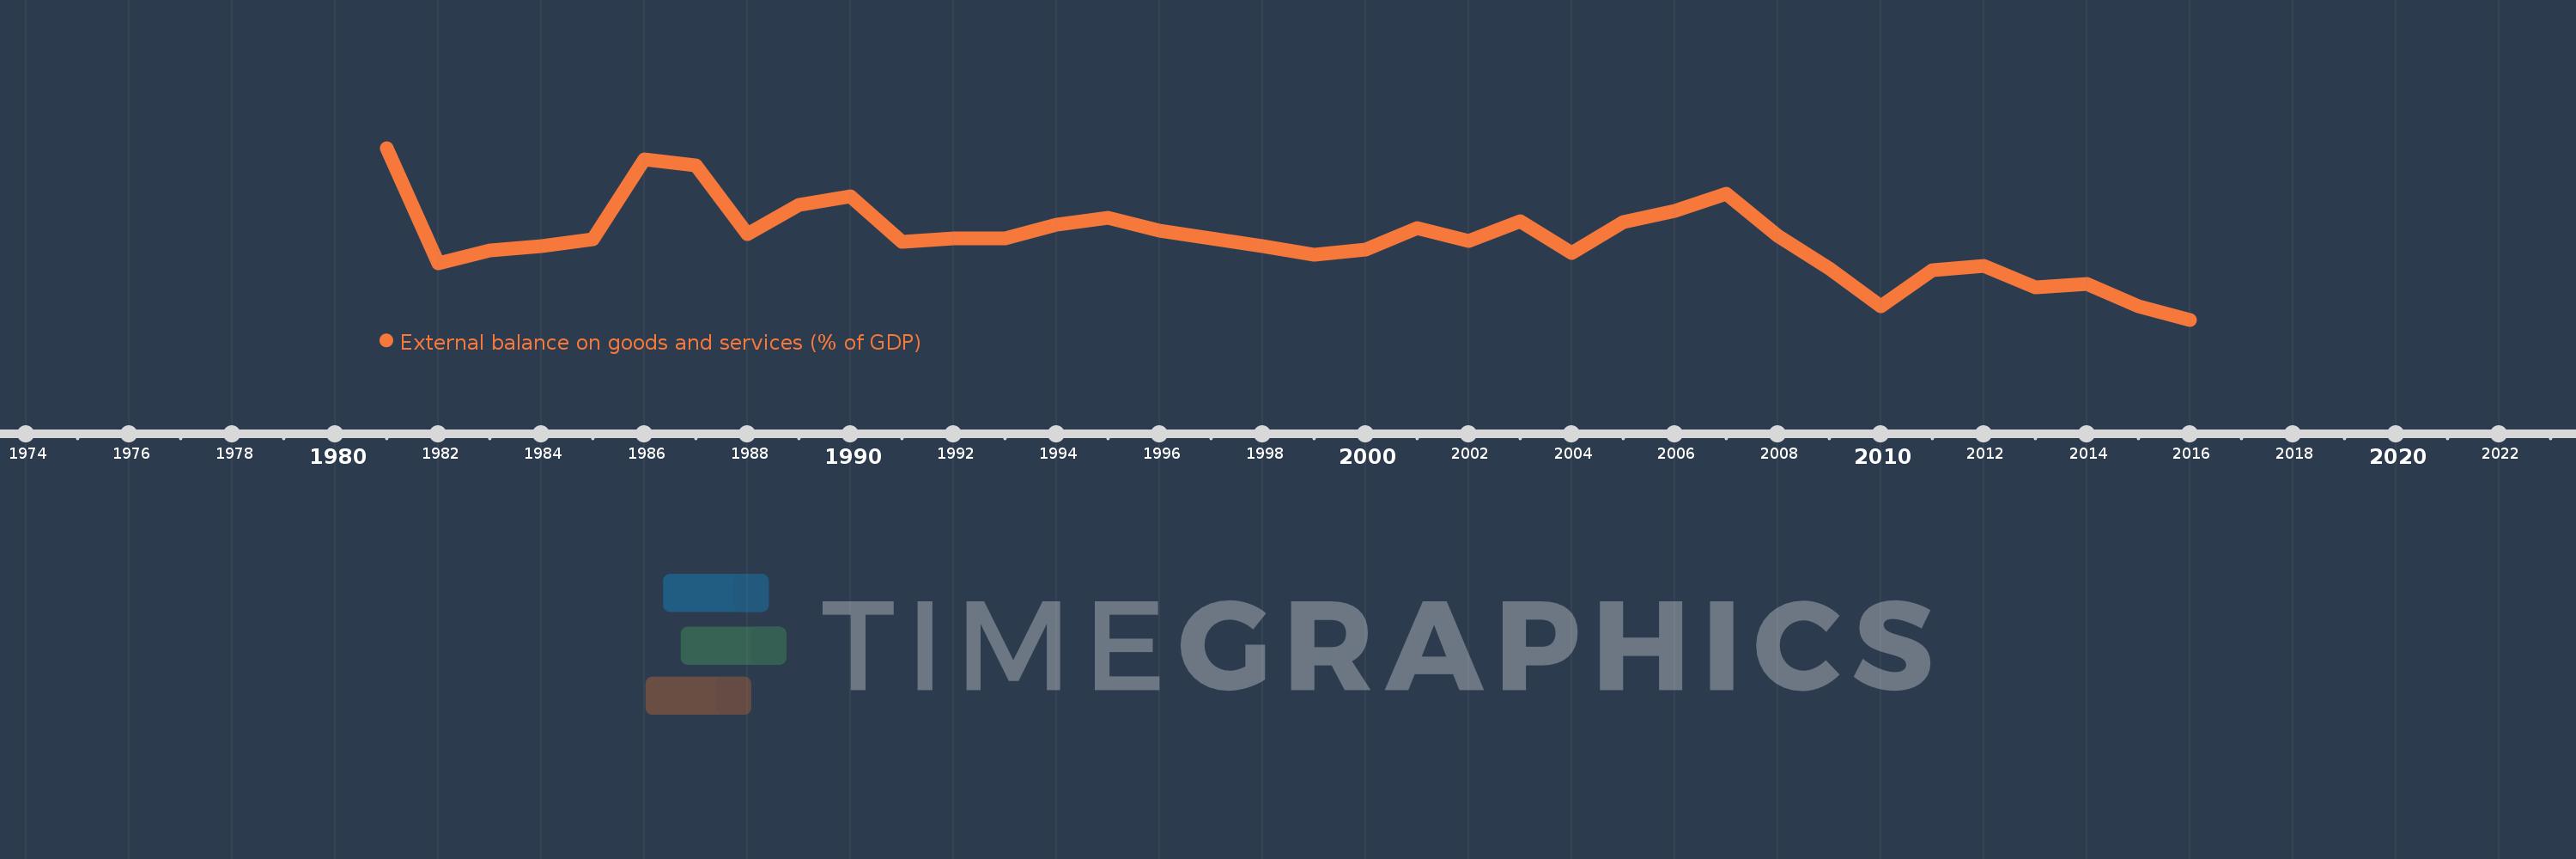
External balance on goods and services (% of GDP)
2016,2015,2014,2013,2012,2011,2010,2009,2008,2007,2006,2005,2004,2003,2002,2001,2000,1999,1998,1997,1996,1995,1994,1993,1992,1991,1990,1989,1988,1987,1986,1985,1984,1983,1982,1981
This statistics in other country:
AfghanistanAlbaniaAlgeriaAngolaAntigua and BarbudaArab WorldArgentinaArmeniaArubaAustraliaAustriaAzerbaijanBahamas, TheBahrainBangladeshBarbadosBelarusBelgiumBelizeBeninBermudaBhutanBoliviaBosnia and HerzegovinaBotswanaBrazilBrunei DarussalamBulgariaBurkina FasoBurundiCabo VerdeCambodiaCameroonCanadaCaribbean small statesCentral African RepublicCentral Europe and the BalticsChadChileChinaColombiaComorosCongo, Dem. Rep.Congo, Rep.Costa RicaCote d'IvoireCroatiaCubaCyprusCzech RepublicDenmarkDjiboutiDominicaDominican RepublicEarly-demographic dividendEast Asia & PacificEast Asia & Pacific (excluding high income)East Asia & Pacific (IDA & IBRD countries)EcuadorEgypt, Arab Rep.El SalvadorEquatorial GuineaEritreaEstoniaEthiopiaEuro areaEurope & Central AsiaEurope & Central Asia (excluding high income)Europe & Central Asia (IDA & IBRD countries)European UnionFaroe IslandsFijiFinlandFragile and conflict affected situationsFranceFrench PolynesiaGabonGambia, TheGeorgiaGermanyGhanaGreeceGrenadaGuatemalaGuineaGuinea-BissauGuyanaHaitiHeavily indebted poor countries (HIPC)High incomeHondurasHong Kong SAR, ChinaHungaryIBRD onlyIcelandIDA & IBRD totalIDA blendIDA onlyIDA totalIndiaIndonesiaIran, Islamic Rep.IraqIrelandIsraelItalyJamaicaJapanJordanKazakhstanKenyaKiribatiKorea, Rep.KosovoKuwaitKyrgyz RepublicLao PDRLate-demographic dividendLatin America & Caribbean Latin America & Caribbean (excluding high income)Latin America & the Caribbean (IDA & IBRD countries)LatviaLeast developed countries: UN classificationLebanonLesothoLiberiaLibyaLithuaniaLow & middle incomeLow incomeLower middle incomeLuxembourgMacao SAR, ChinaMacedonia, FYRMadagascarMalawiMalaysiaMaldivesMaliMaltaMauritaniaMauritiusMexicoMicronesia, Fed. Sts.Middle East & North AfricaMiddle East & North Africa (excluding high income)Middle East & North Africa (IDA & IBRD countries)Middle incomeMoldovaMongoliaMontenegroMoroccoMozambiqueMyanmarNamibiaNepalNetherlandsNew CaledoniaNew ZealandNicaraguaNigerNigeriaNorth AmericaNorwayOECD membersOmanOther small statesPacific island small statesPakistanPalauPanamaPapua New GuineaParaguayPeruPhilippinesPolandPortugalPost-demographic dividendPre-demographic dividendPuerto RicoQatarRomaniaRussian FederationRwandaSamoaSaudi ArabiaSenegalSerbiaSeychellesSierra LeoneSingaporeSlovak RepublicSloveniaSmall statesSolomon IslandsSomaliaSouth AfricaSouth AsiaSouth Asia (IDA & IBRD)South SudanSpainSri LankaSt. Kitts and NevisSt. LuciaSt. Vincent and the GrenadinesSub-Saharan Africa Sub-Saharan Africa (excluding high income)Sub-Saharan Africa (IDA & IBRD countries)SudanSurinameSwazilandSwedenSwitzerlandSyrian Arab RepublicTajikistanTanzaniaThailandTimor-LesteTogoTongaTrinidad and TobagoTunisiaTurkeyTurkmenistanUgandaUkraineUnited Arab EmiratesUnited KingdomUnited StatesUpper middle incomeUruguayUzbekistanVanuatuVenezuela, RBVietnamWest Bank and GazaWorldYemen, Rep.ZambiaZimbabwe Timeline:
This timeline shows a graph from 1981 to 2016 of Namibia. No data until 1980. Number of actual observations by date: 36.
Source name:
World Development Indicators
Source organization:
World Bank national accounts data, and OECD National Accounts data files.
Categories, topics:
Economy & Growth, Trade
Last updated:
apr 23, 2017
Indicators value changes by year
Minimum:
-23.805
jan 1, 2016
Maximum:
14.039
jan 1, 1981
At the date of observation
Value
Absolute change
Change from previous value
jan 1, 1981
14.039
+14.039
0.0%
jan 1, 1982
-11.351
-25.39
-180.85%
jan 1, 1983
-8.533
+2.818
-24.83%
jan 1, 1984
-7.571
+0.962
-11.27%
jan 1, 1985
-6.149
+1.423
-18.79%
jan 1, 1986
11.448
+17.596
-286.18%
jan 1, 1987
10.289
-1.158
-10.12%
jan 1, 1988
-4.886
-15.175
-147.49%
jan 1, 1989
1.497
+6.383
-130.63%
jan 1, 1990
3.344
+1.847
123.42%
jan 1, 1991
-6.604
-9.948
-297.52%
jan 1, 1992
-5.84
+0.765
-11.58%
jan 1, 1993
-5.911
-0.072
1.23%
jan 1, 1994
-2.918
+2.994
-50.64%
jan 1, 1995
-1.293
+1.625
-55.68%
jan 1, 1996
-4.222
-2.928
226.48%
jan 1, 1997
-5.799
-1.577
37.36%
jan 1, 1998
-7.645
-1.847
31.85%
jan 1, 1999
-9.505
-1.86
24.32%
jan 1, 2000
-8.346
+1.158
-12.19%
jan 1, 2001
-3.673
+4.674
-56.0%
jan 1, 2002
-6.491
-2.819
76.75%
jan 1, 2003
-2.07
+4.422
-68.11%
jan 1, 2004
-9.085
-7.015
338.88%
jan 1, 2005
-2.267
+6.817
-75.04%
jan 1, 2006
0.137
+2.404
-106.04%
jan 1, 2007
3.908
+3.772
2.75K%
jan 1, 2008
-5.335
-9.244
-236.5%
jan 1, 2009
-12.499
-7.164
134.27%
jan 1, 2010
-20.784
-8.285
66.29%
jan 1, 2011
-12.899
+7.885
-37.94%
jan 1, 2012
-11.949
+0.95
-7.37%
jan 1, 2013
-16.743
-4.795
40.13%
jan 1, 2014
-15.936
+0.807
-4.82%
jan 1, 2015
-20.864
-4.928
30.92%
jan 1, 2016
-23.805
-2.941
14.09%
Ranking of countries by current statistics by years


Comments: