29
/
en
AIzaSyAYiBZKx7MnpbEhh9jyipgxe19OcubqV5w
April 1, 2024
206686
Nepal
NPL
true
2
1
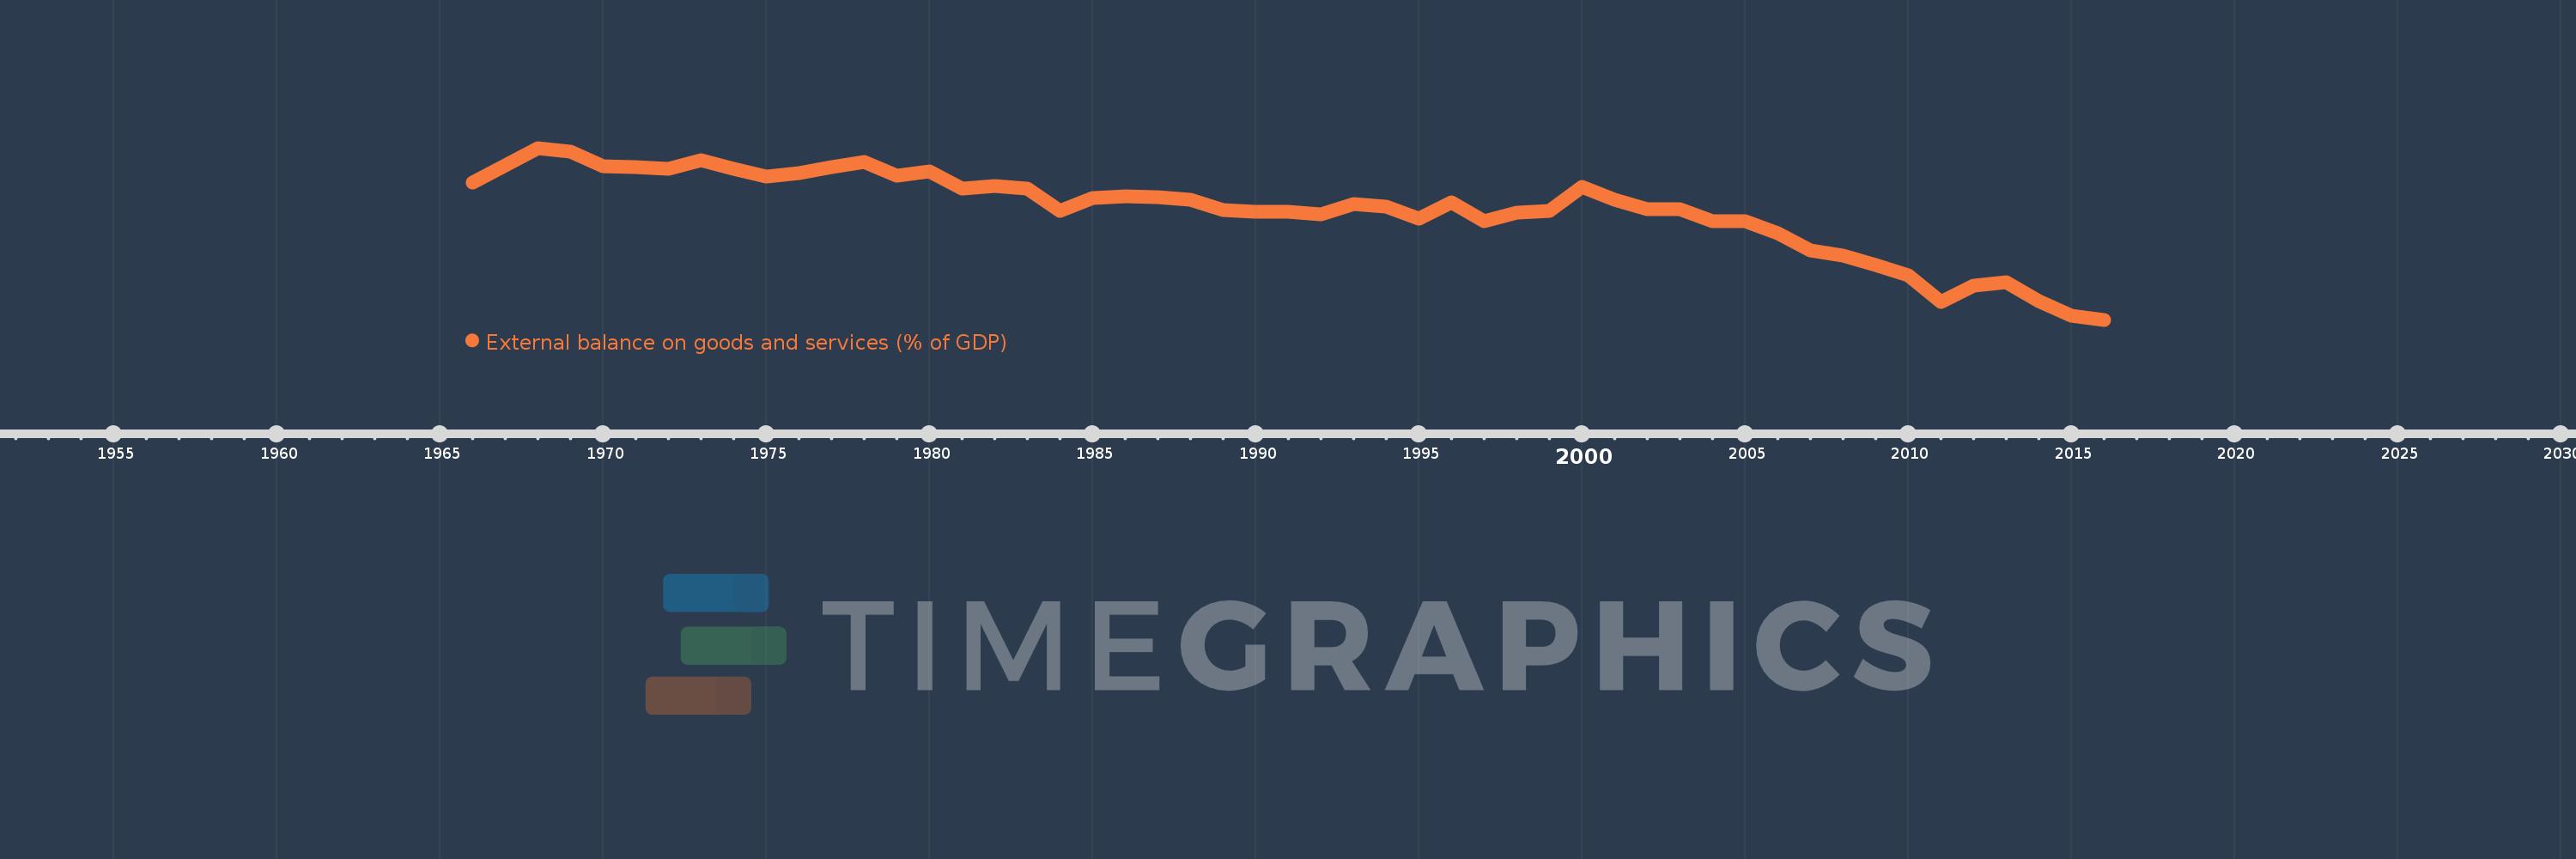
External balance on goods and services (% of GDP)
2016,2015,2014,2013,2012,2011,2010,2009,2008,2007,2006,2005,2004,2003,2002,2001,2000,1999,1998,1997,1996,1995,1994,1993,1992,1991,1990,1989,1988,1987,1986,1985,1984,1983,1982,1981,1980,1979,1978,1977,1976,1975,1974,1973,1972,1971,1970,1969,1968,1967,1966
This statistics in other country:
AfghanistanAlbaniaAlgeriaAngolaAntigua and BarbudaArab WorldArgentinaArmeniaArubaAustraliaAustriaAzerbaijanBahamas, TheBahrainBangladeshBarbadosBelarusBelgiumBelizeBeninBermudaBhutanBoliviaBosnia and HerzegovinaBotswanaBrazilBrunei DarussalamBulgariaBurkina FasoBurundiCabo VerdeCambodiaCameroonCanadaCaribbean small statesCentral African RepublicCentral Europe and the BalticsChadChileChinaColombiaComorosCongo, Dem. Rep.Congo, Rep.Costa RicaCote d'IvoireCroatiaCubaCyprusCzech RepublicDenmarkDjiboutiDominicaDominican RepublicEarly-demographic dividendEast Asia & PacificEast Asia & Pacific (excluding high income)East Asia & Pacific (IDA & IBRD countries)EcuadorEgypt, Arab Rep.El SalvadorEquatorial GuineaEritreaEstoniaEthiopiaEuro areaEurope & Central AsiaEurope & Central Asia (excluding high income)Europe & Central Asia (IDA & IBRD countries)European UnionFaroe IslandsFijiFinlandFragile and conflict affected situationsFranceFrench PolynesiaGabonGambia, TheGeorgiaGermanyGhanaGreeceGrenadaGuatemalaGuineaGuinea-BissauGuyanaHaitiHeavily indebted poor countries (HIPC)High incomeHondurasHong Kong SAR, ChinaHungaryIBRD onlyIcelandIDA & IBRD totalIDA blendIDA onlyIDA totalIndiaIndonesiaIran, Islamic Rep.IraqIrelandIsraelItalyJamaicaJapanJordanKazakhstanKenyaKiribatiKorea, Rep.KosovoKuwaitKyrgyz RepublicLao PDRLate-demographic dividendLatin America & Caribbean Latin America & Caribbean (excluding high income)Latin America & the Caribbean (IDA & IBRD countries)LatviaLeast developed countries: UN classificationLebanonLesothoLiberiaLibyaLithuaniaLow & middle incomeLow incomeLower middle incomeLuxembourgMacao SAR, ChinaMacedonia, FYRMadagascarMalawiMalaysiaMaldivesMaliMaltaMauritaniaMauritiusMexicoMicronesia, Fed. Sts.Middle East & North AfricaMiddle East & North Africa (excluding high income)Middle East & North Africa (IDA & IBRD countries)Middle incomeMoldovaMongoliaMontenegroMoroccoMozambiqueMyanmarNamibiaNepalNetherlandsNew CaledoniaNew ZealandNicaraguaNigerNigeriaNorth AmericaNorwayOECD membersOmanOther small statesPacific island small statesPakistanPalauPanamaPapua New GuineaParaguayPeruPhilippinesPolandPortugalPost-demographic dividendPre-demographic dividendPuerto RicoQatarRomaniaRussian FederationRwandaSamoaSaudi ArabiaSenegalSerbiaSeychellesSierra LeoneSingaporeSlovak RepublicSloveniaSmall statesSolomon IslandsSomaliaSouth AfricaSouth AsiaSouth Asia (IDA & IBRD)South SudanSpainSri LankaSt. Kitts and NevisSt. LuciaSt. Vincent and the GrenadinesSub-Saharan Africa Sub-Saharan Africa (excluding high income)Sub-Saharan Africa (IDA & IBRD countries)SudanSurinameSwazilandSwedenSwitzerlandSyrian Arab RepublicTajikistanTanzaniaThailandTimor-LesteTogoTongaTrinidad and TobagoTunisiaTurkeyTurkmenistanUgandaUkraineUnited Arab EmiratesUnited KingdomUnited StatesUpper middle incomeUruguayUzbekistanVanuatuVenezuela, RBVietnamWest Bank and GazaWorldYemen, Rep.ZambiaZimbabwe Timeline:
This timeline shows a graph from 1966 to 2016 of Nepal. No data until 1965. Number of actual observations by date: 51.
Source name:
World Development Indicators
Source organization:
World Bank national accounts data, and OECD National Accounts data files.
Categories, topics:
Economy & Growth, Trade
Last updated:
apr 23, 2017
Indicators value changes by year
Minimum:
-29.988
jan 1, 2016
Maximum:
-0.078
jan 1, 1968
At the date of observation
Value
Absolute change
Change from previous value
jan 1, 1966
-6.159
-6.159
0.0%
jan 1, 1967
-3.112
+3.047
-49.47%
jan 1, 1968
-0.078
+3.034
-97.5%
jan 1, 1969
-0.655
-0.577
740.67%
jan 1, 1970
-3.206
-2.551
389.29%
jan 1, 1971
-3.399
-0.193
6.01%
jan 1, 1972
-3.726
-0.327
9.62%
jan 1, 1973
-2.257
+1.469
-39.43%
jan 1, 1974
-3.762
-1.505
66.69%
jan 1, 1975
-5.098
-1.337
35.54%
jan 1, 1976
-4.466
+0.633
-12.41%
jan 1, 1977
-3.403
+1.062
-23.79%
jan 1, 1978
-2.529
+0.875
-25.7%
jan 1, 1979
-4.901
-2.372
93.78%
jan 1, 1980
-4.182
+0.719
-14.67%
jan 1, 1981
-7.19
-3.008
71.94%
jan 1, 1982
-6.716
+0.474
-6.59%
jan 1, 1983
-7.216
-0.499
7.44%
jan 1, 1984
-11.084
-3.868
53.61%
jan 1, 1985
-8.797
+2.287
-20.64%
jan 1, 1986
-8.47
+0.326
-3.71%
jan 1, 1987
-8.64
-0.17
2.01%
jan 1, 1988
-9.093
-0.453
5.24%
jan 1, 1989
-10.935
-1.841
20.25%
jan 1, 1990
-11.216
-0.281
2.57%
jan 1, 1991
-11.134
+0.082
-0.73%
jan 1, 1992
-11.694
-0.559
5.02%
jan 1, 1993
-9.776
+1.918
-16.4%
jan 1, 1994
-10.324
-0.548
5.6%
jan 1, 1995
-12.444
-2.121
20.54%
jan 1, 1996
-9.544
+2.9
-23.3%
jan 1, 1997
-12.823
-3.278
34.35%
jan 1, 1998
-11.38
+1.443
-11.25%
jan 1, 1999
-11.065
+0.314
-2.76%
jan 1, 2000
-6.87
+4.195
-37.91%
jan 1, 2001
-9.143
-2.273
33.08%
jan 1, 2002
-10.678
-1.536
16.8%
jan 1, 2003
-10.756
-0.078
0.73%
jan 1, 2004
-12.848
-2.092
19.45%
jan 1, 2005
-12.782
+0.066
-0.52%
jan 1, 2006
-14.896
-2.114
16.54%
jan 1, 2007
-17.869
-2.973
19.96%
jan 1, 2008
-18.868
-0.999
5.59%
jan 1, 2009
-20.485
-1.617
8.57%
jan 1, 2010
-22.241
-1.756
8.57%
jan 1, 2011
-26.82
-4.579
20.59%
jan 1, 2012
-24.02
+2.8
-10.44%
jan 1, 2013
-23.51
+0.51
-2.12%
jan 1, 2014
-26.768
-3.257
13.86%
jan 1, 2015
-29.245
-2.477
9.25%
jan 1, 2016
-29.988
-0.743
2.54%
Ranking of countries by current statistics by years


Comments: