29
/
en
AIzaSyAYiBZKx7MnpbEhh9jyipgxe19OcubqV5w
April 1, 2024
182889
Macao SAR, China
MAC
true
2
1
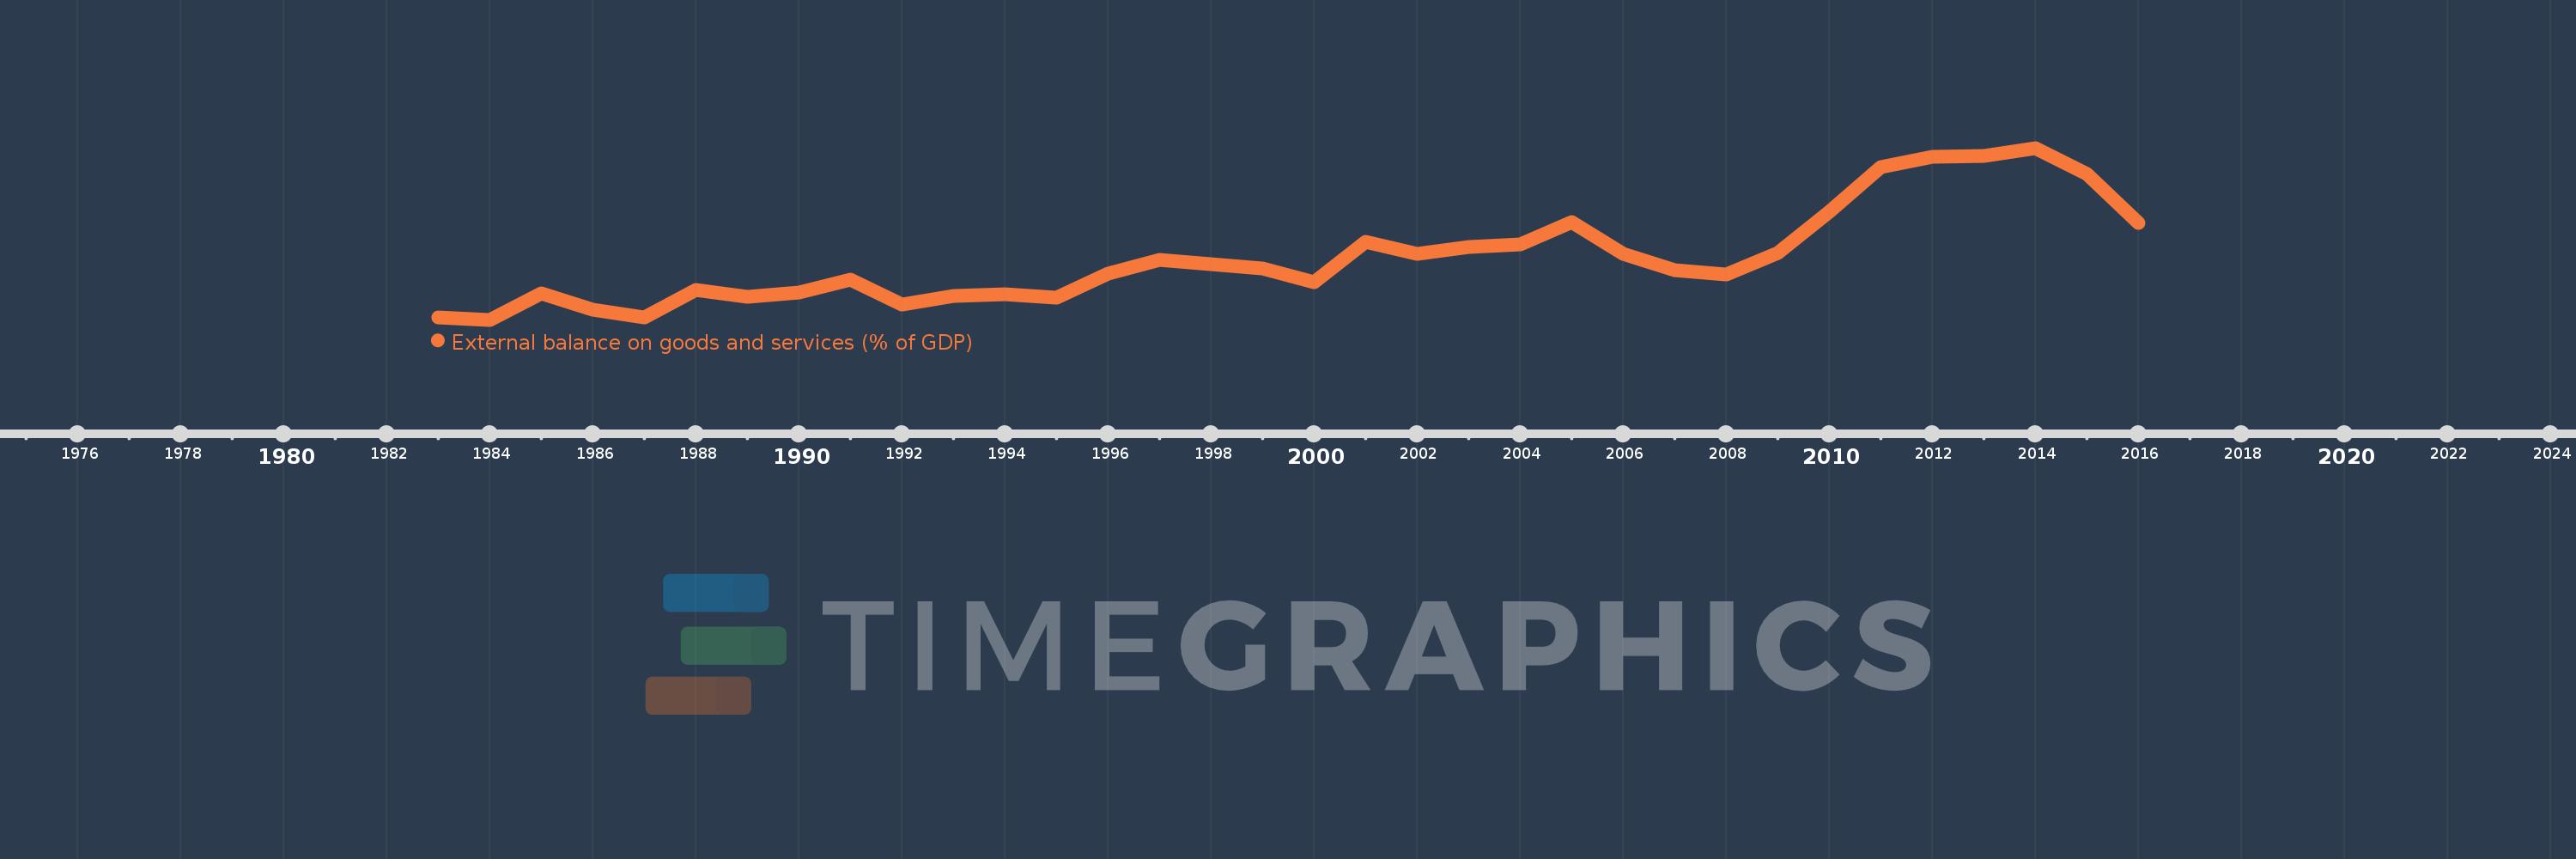
External balance on goods and services (% of GDP)
2016,2015,2014,2013,2012,2011,2010,2009,2008,2007,2006,2005,2004,2003,2002,2001,2000,1999,1998,1997,1996,1995,1994,1993,1992,1991,1990,1989,1988,1987,1986,1985,1984,1983
This statistics in other country:
AfghanistanAlbaniaAlgeriaAngolaAntigua and BarbudaArab WorldArgentinaArmeniaArubaAustraliaAustriaAzerbaijanBahamas, TheBahrainBangladeshBarbadosBelarusBelgiumBelizeBeninBermudaBhutanBoliviaBosnia and HerzegovinaBotswanaBrazilBrunei DarussalamBulgariaBurkina FasoBurundiCabo VerdeCambodiaCameroonCanadaCaribbean small statesCentral African RepublicCentral Europe and the BalticsChadChileChinaColombiaComorosCongo, Dem. Rep.Congo, Rep.Costa RicaCote d'IvoireCroatiaCubaCyprusCzech RepublicDenmarkDjiboutiDominicaDominican RepublicEarly-demographic dividendEast Asia & PacificEast Asia & Pacific (excluding high income)East Asia & Pacific (IDA & IBRD countries)EcuadorEgypt, Arab Rep.El SalvadorEquatorial GuineaEritreaEstoniaEthiopiaEuro areaEurope & Central AsiaEurope & Central Asia (excluding high income)Europe & Central Asia (IDA & IBRD countries)European UnionFaroe IslandsFijiFinlandFragile and conflict affected situationsFranceFrench PolynesiaGabonGambia, TheGeorgiaGermanyGhanaGreeceGrenadaGuatemalaGuineaGuinea-BissauGuyanaHaitiHeavily indebted poor countries (HIPC)High incomeHondurasHong Kong SAR, ChinaHungaryIBRD onlyIcelandIDA & IBRD totalIDA blendIDA onlyIDA totalIndiaIndonesiaIran, Islamic Rep.IraqIrelandIsraelItalyJamaicaJapanJordanKazakhstanKenyaKiribatiKorea, Rep.KosovoKuwaitKyrgyz RepublicLao PDRLate-demographic dividendLatin America & Caribbean Latin America & Caribbean (excluding high income)Latin America & the Caribbean (IDA & IBRD countries)LatviaLeast developed countries: UN classificationLebanonLesothoLiberiaLibyaLithuaniaLow & middle incomeLow incomeLower middle incomeLuxembourgMacao SAR, ChinaMacedonia, FYRMadagascarMalawiMalaysiaMaldivesMaliMaltaMauritaniaMauritiusMexicoMicronesia, Fed. Sts.Middle East & North AfricaMiddle East & North Africa (excluding high income)Middle East & North Africa (IDA & IBRD countries)Middle incomeMoldovaMongoliaMontenegroMoroccoMozambiqueMyanmarNamibiaNepalNetherlandsNew CaledoniaNew ZealandNicaraguaNigerNigeriaNorth AmericaNorwayOECD membersOmanOther small statesPacific island small statesPakistanPalauPanamaPapua New GuineaParaguayPeruPhilippinesPolandPortugalPost-demographic dividendPre-demographic dividendPuerto RicoQatarRomaniaRussian FederationRwandaSamoaSaudi ArabiaSenegalSerbiaSeychellesSierra LeoneSingaporeSlovak RepublicSloveniaSmall statesSolomon IslandsSomaliaSouth AfricaSouth AsiaSouth Asia (IDA & IBRD)South SudanSpainSri LankaSt. Kitts and NevisSt. LuciaSt. Vincent and the GrenadinesSub-Saharan Africa Sub-Saharan Africa (excluding high income)Sub-Saharan Africa (IDA & IBRD countries)SudanSurinameSwazilandSwedenSwitzerlandSyrian Arab RepublicTajikistanTanzaniaThailandTimor-LesteTogoTongaTrinidad and TobagoTunisiaTurkeyTurkmenistanUgandaUkraineUnited Arab EmiratesUnited KingdomUnited StatesUpper middle incomeUruguayUzbekistanVanuatuVenezuela, RBVietnamWest Bank and GazaWorldYemen, Rep.ZambiaZimbabwe Timeline:
This timeline shows a graph from 1983 to 2016 of Macao SAR, China. No data until 1982. Number of actual observations by date: 34.
Source name:
World Development Indicators
Source organization:
World Bank national accounts data, and OECD National Accounts data files.
Categories, topics:
Economy & Growth, Trade
Last updated:
apr 23, 2017
Indicators value changes by year
Minimum:
15.447
jan 1, 1984
Maximum:
60.233
jan 1, 2014
At the date of observation
Value
Absolute change
Change from previous value
jan 1, 1983
15.958
+15.958
0.0%
jan 1, 1984
15.447
-0.511
-3.2%
jan 1, 1985
22.353
+6.906
44.7%
jan 1, 1986
18.153
-4.199
-18.79%
jan 1, 1987
16.011
-2.142
-11.8%
jan 1, 1988
23.177
+7.166
44.75%
jan 1, 1989
21.35
-1.827
-7.88%
jan 1, 1990
22.582
+1.232
5.77%
jan 1, 1991
25.996
+3.414
15.12%
jan 1, 1992
19.505
-6.491
-24.97%
jan 1, 1993
21.62
+2.115
10.84%
jan 1, 1994
22.185
+0.565
2.61%
jan 1, 1995
21.098
-1.088
-4.9%
jan 1, 1996
27.494
+6.396
30.32%
jan 1, 1997
31.055
+3.561
12.95%
jan 1, 1998
29.857
-1.199
-3.86%
jan 1, 1999
28.744
-1.112
-3.73%
jan 1, 2000
25.182
-3.562
-12.39%
jan 1, 2001
35.792
+10.61
42.13%
jan 1, 2002
32.66
-3.132
-8.75%
jan 1, 2003
34.374
+1.714
5.25%
jan 1, 2004
35.152
+0.778
2.26%
jan 1, 2005
40.859
+5.706
16.23%
jan 1, 2006
32.582
-8.277
-20.26%
jan 1, 2007
28.467
-4.115
-12.63%
jan 1, 2008
27.241
-1.225
-4.3%
jan 1, 2009
32.954
+5.712
20.97%
jan 1, 2010
43.692
+10.738
32.59%
jan 1, 2011
55.136
+11.445
26.19%
jan 1, 2012
58.003
+2.867
5.2%
jan 1, 2013
58.041
+0.038
0.07%
jan 1, 2014
60.233
+2.191
3.78%
jan 1, 2015
53.362
-6.871
-11.41%
jan 1, 2016
40.655
-12.707
-23.81%
Ranking of countries by current statistics by years


Comments: