29
/
en
AIzaSyAYiBZKx7MnpbEhh9jyipgxe19OcubqV5w
April 1, 2024
215228
Oman
OMN
true
2
1
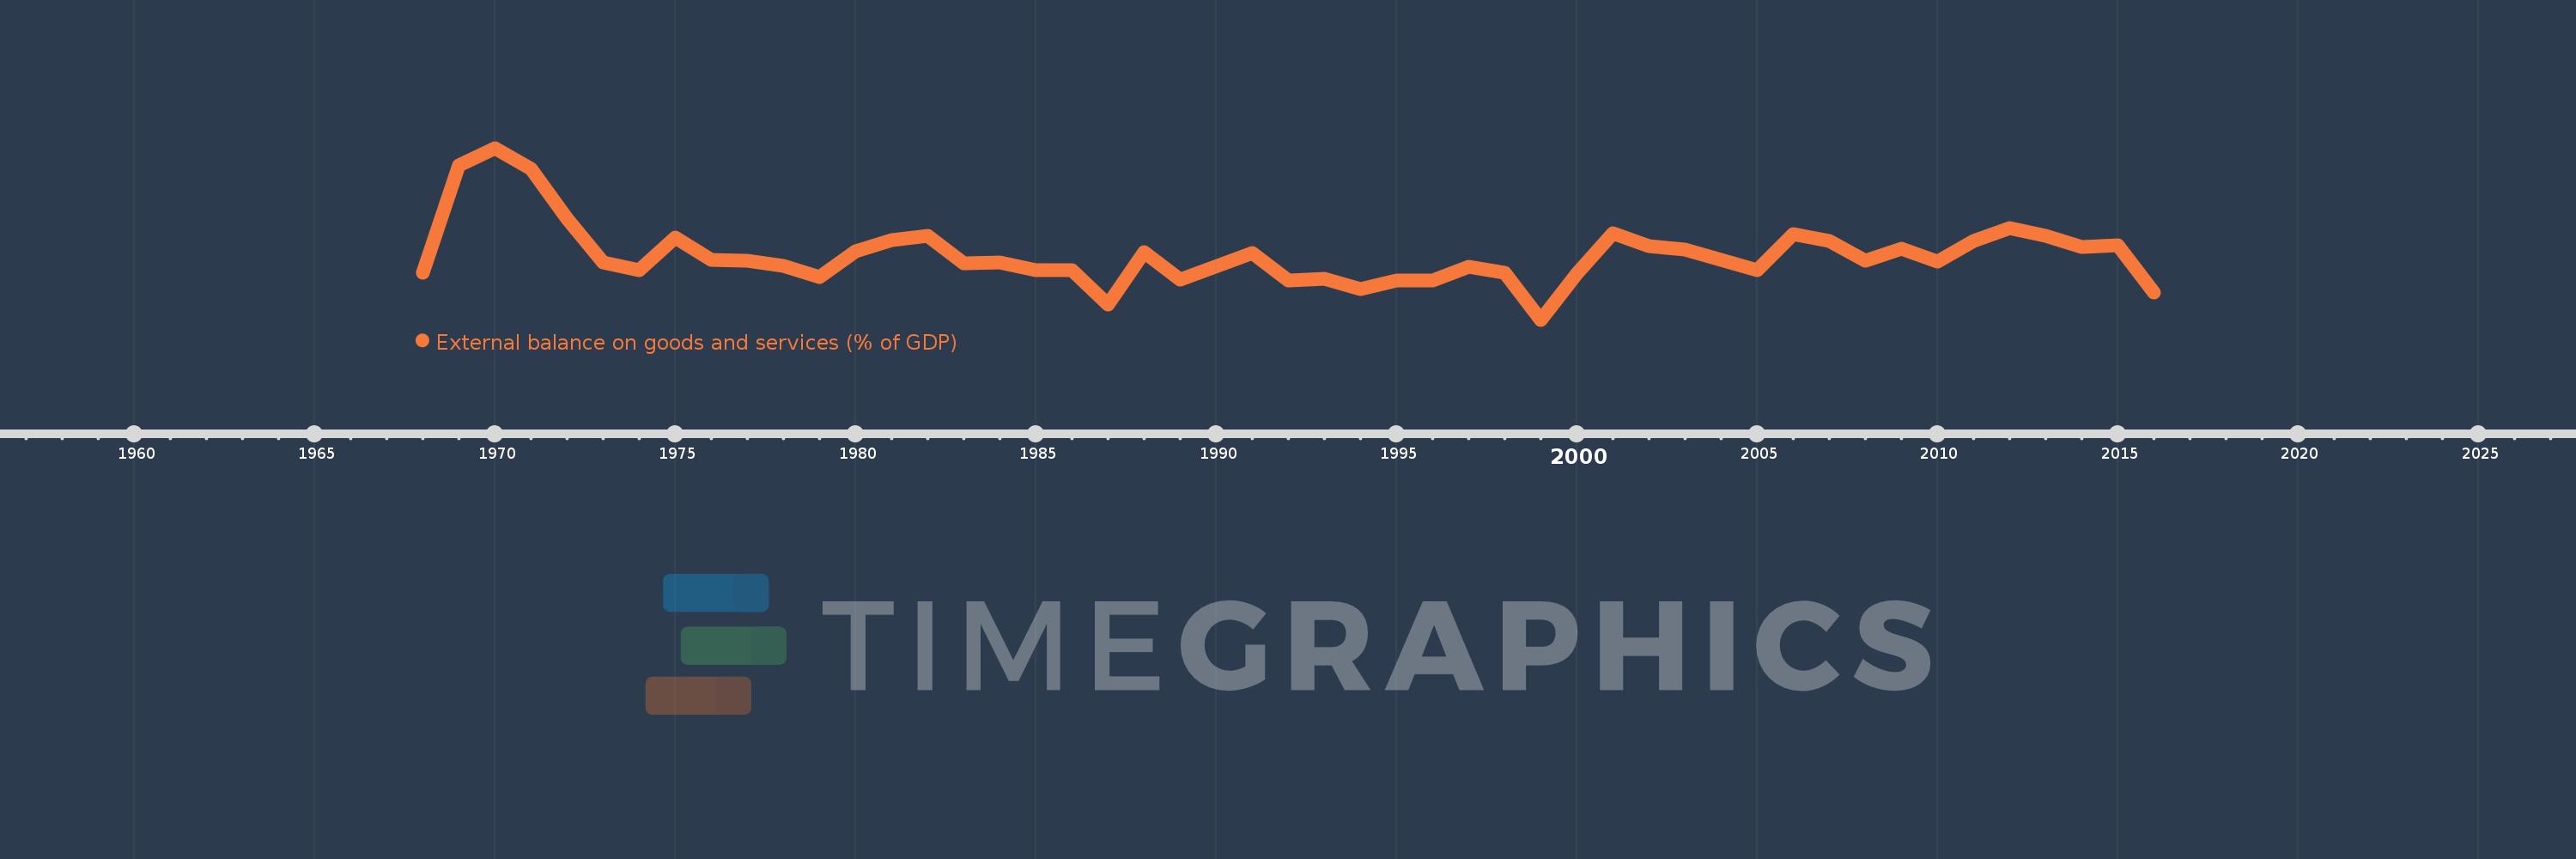
External balance on goods and services (% of GDP)
2016,2015,2014,2013,2012,2011,2010,2009,2008,2007,2006,2005,2004,2003,2002,2001,2000,1999,1998,1997,1996,1995,1994,1993,1992,1991,1989,1988,1987,1986,1985,1984,1983,1982,1981,1980,1979,1978,1977,1976,1975,1974,1973,1972,1971,1970,1969,1968
This statistics in other country:
AfghanistanAlbaniaAlgeriaAngolaAntigua and BarbudaArab WorldArgentinaArmeniaArubaAustraliaAustriaAzerbaijanBahamas, TheBahrainBangladeshBarbadosBelarusBelgiumBelizeBeninBermudaBhutanBoliviaBosnia and HerzegovinaBotswanaBrazilBrunei DarussalamBulgariaBurkina FasoBurundiCabo VerdeCambodiaCameroonCanadaCaribbean small statesCentral African RepublicCentral Europe and the BalticsChadChileChinaColombiaComorosCongo, Dem. Rep.Congo, Rep.Costa RicaCote d'IvoireCroatiaCubaCyprusCzech RepublicDenmarkDjiboutiDominicaDominican RepublicEarly-demographic dividendEast Asia & PacificEast Asia & Pacific (excluding high income)East Asia & Pacific (IDA & IBRD countries)EcuadorEgypt, Arab Rep.El SalvadorEquatorial GuineaEritreaEstoniaEthiopiaEuro areaEurope & Central AsiaEurope & Central Asia (excluding high income)Europe & Central Asia (IDA & IBRD countries)European UnionFaroe IslandsFijiFinlandFragile and conflict affected situationsFranceFrench PolynesiaGabonGambia, TheGeorgiaGermanyGhanaGreeceGrenadaGuatemalaGuineaGuinea-BissauGuyanaHaitiHeavily indebted poor countries (HIPC)High incomeHondurasHong Kong SAR, ChinaHungaryIBRD onlyIcelandIDA & IBRD totalIDA blendIDA onlyIDA totalIndiaIndonesiaIran, Islamic Rep.IraqIrelandIsraelItalyJamaicaJapanJordanKazakhstanKenyaKiribatiKorea, Rep.KosovoKuwaitKyrgyz RepublicLao PDRLate-demographic dividendLatin America & Caribbean Latin America & Caribbean (excluding high income)Latin America & the Caribbean (IDA & IBRD countries)LatviaLeast developed countries: UN classificationLebanonLesothoLiberiaLibyaLithuaniaLow & middle incomeLow incomeLower middle incomeLuxembourgMacao SAR, ChinaMacedonia, FYRMadagascarMalawiMalaysiaMaldivesMaliMaltaMauritaniaMauritiusMexicoMicronesia, Fed. Sts.Middle East & North AfricaMiddle East & North Africa (excluding high income)Middle East & North Africa (IDA & IBRD countries)Middle incomeMoldovaMongoliaMontenegroMoroccoMozambiqueMyanmarNamibiaNepalNetherlandsNew CaledoniaNew ZealandNicaraguaNigerNigeriaNorth AmericaNorwayOECD membersOmanOther small statesPacific island small statesPakistanPalauPanamaPapua New GuineaParaguayPeruPhilippinesPolandPortugalPost-demographic dividendPre-demographic dividendPuerto RicoQatarRomaniaRussian FederationRwandaSamoaSaudi ArabiaSenegalSerbiaSeychellesSierra LeoneSingaporeSlovak RepublicSloveniaSmall statesSolomon IslandsSomaliaSouth AfricaSouth AsiaSouth Asia (IDA & IBRD)South SudanSpainSri LankaSt. Kitts and NevisSt. LuciaSt. Vincent and the GrenadinesSub-Saharan Africa Sub-Saharan Africa (excluding high income)Sub-Saharan Africa (IDA & IBRD countries)SudanSurinameSwazilandSwedenSwitzerlandSyrian Arab RepublicTajikistanTanzaniaThailandTimor-LesteTogoTongaTrinidad and TobagoTunisiaTurkeyTurkmenistanUgandaUkraineUnited Arab EmiratesUnited KingdomUnited StatesUpper middle incomeUruguayUzbekistanVanuatuVenezuela, RBVietnamWest Bank and GazaWorldYemen, Rep.ZambiaZimbabwe Timeline:
This timeline shows a graph from 1968 to 2016 of Oman. No data until 1967. Number of actual observations by date: 48.
Source name:
World Development Indicators
Source organization:
World Bank national accounts data, and OECD National Accounts data files.
Categories, topics:
Economy & Growth, Trade
Last updated:
apr 23, 2017
Indicators value changes by year
Minimum:
-7.755
jan 1, 1999
At the date of observation
Value
Absolute change
Change from previous value
jan 1, 1968
11.34
+11.34
0.0%
jan 1, 1969
55.4
+44.06
388.53%
jan 1, 1970
62.7
+7.3
13.18%
jan 1, 1971
54.026
-8.674
-13.83%
jan 1, 1972
33.653
-20.373
-37.71%
jan 1, 1973
15.625
-18.028
-53.57%
jan 1, 1974
12.633
-2.992
-19.15%
jan 1, 1975
25.963
+13.33
105.52%
jan 1, 1976
16.86
-9.103
-35.06%
jan 1, 1977
16.363
-0.497
-2.95%
jan 1, 1978
14.259
-2.105
-12.86%
jan 1, 1979
9.593
-4.665
-32.72%
jan 1, 1980
20.349
+10.756
112.12%
jan 1, 1981
25.004
+4.655
22.87%
jan 1, 1982
26.598
+1.595
6.38%
jan 1, 1983
15.394
-11.204
-42.12%
jan 1, 1984
15.585
+0.19
1.24%
jan 1, 1985
12.701
-2.883
-18.5%
jan 1, 1986
12.645
-0.056
-0.44%
jan 1, 1987
-1.68
-14.325
-113.29%
jan 1, 1988
19.811
+21.491
-1.28K%
jan 1, 1989
8.653
-11.158
-56.32%
jan 1, 1991
19.631
+10.978
126.88%
jan 1, 1992
8.324
-11.307
-57.6%
jan 1, 1993
9.169
+0.845
10.15%
jan 1, 1994
4.996
-4.173
-45.51%
jan 1, 1995
8.214
+3.217
64.4%
jan 1, 1996
8.479
+0.265
3.23%
jan 1, 1997
14.044
+5.565
65.63%
jan 1, 1998
11.446
-2.598
-18.5%
jan 1, 1999
-7.755
-19.201
-167.75%
jan 1, 2000
11.125
+18.88
-243.45%
jan 1, 2001
27.784
+16.66
149.75%
jan 1, 2002
22.368
-5.416
-19.49%
jan 1, 2003
21.188
-1.18
-5.28%
jan 1, 2004
16.963
-4.225
-19.94%
jan 1, 2005
12.508
-4.454
-26.26%
jan 1, 2006
27.219
+14.711
117.61%
jan 1, 2007
24.508
-2.711
-9.96%
jan 1, 2008
16.494
-8.014
-32.7%
jan 1, 2009
21.3
+4.806
29.14%
jan 1, 2010
15.99
-5.31
-24.93%
jan 1, 2011
24.446
+8.456
52.88%
jan 1, 2012
29.879
+5.433
22.22%
jan 1, 2013
26.639
-3.24
-10.84%
jan 1, 2014
22.239
-4.4
-16.52%
jan 1, 2015
22.819
+0.58
2.61%
jan 1, 2016
3.579
-19.24
-84.32%
Ranking of countries by current statistics by years


Comments: