29
/
en
AIzaSyAYiBZKx7MnpbEhh9jyipgxe19OcubqV5w
April 1, 2024
201503
Morocco
MAR
true
2
1
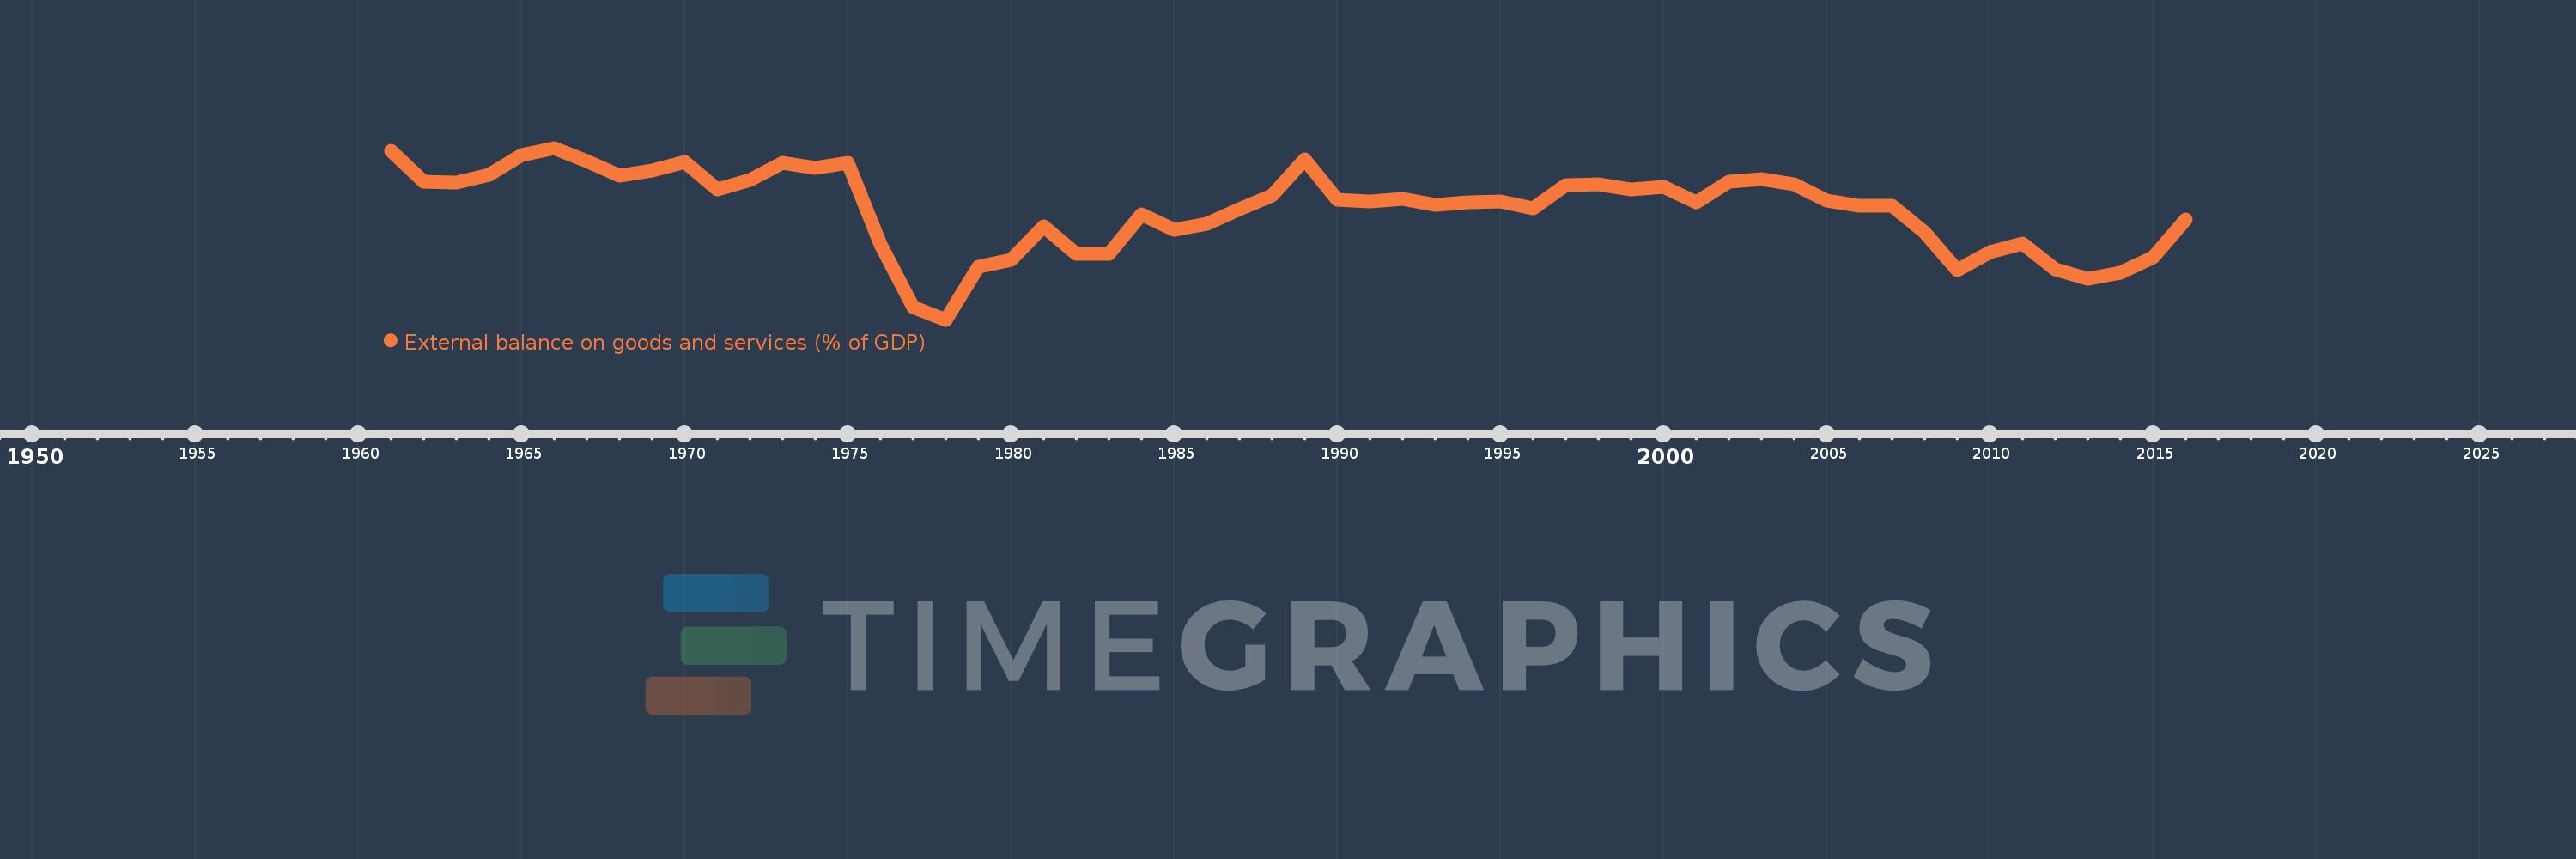
External balance on goods and services (% of GDP)
2016,2015,2014,2013,2012,2011,2010,2009,2008,2007,2006,2005,2004,2003,2002,2001,2000,1999,1998,1997,1996,1995,1994,1993,1992,1991,1990,1989,1988,1987,1986,1985,1984,1983,1982,1981,1980,1979,1978,1977,1976,1975,1974,1973,1972,1971,1970,1969,1968,1967,1966,1965,1964,1963,1962,1961
This statistics in other country:
AfghanistanAlbaniaAlgeriaAngolaAntigua and BarbudaArab WorldArgentinaArmeniaArubaAustraliaAustriaAzerbaijanBahamas, TheBahrainBangladeshBarbadosBelarusBelgiumBelizeBeninBermudaBhutanBoliviaBosnia and HerzegovinaBotswanaBrazilBrunei DarussalamBulgariaBurkina FasoBurundiCabo VerdeCambodiaCameroonCanadaCaribbean small statesCentral African RepublicCentral Europe and the BalticsChadChileChinaColombiaComorosCongo, Dem. Rep.Congo, Rep.Costa RicaCote d'IvoireCroatiaCubaCyprusCzech RepublicDenmarkDjiboutiDominicaDominican RepublicEarly-demographic dividendEast Asia & PacificEast Asia & Pacific (excluding high income)East Asia & Pacific (IDA & IBRD countries)EcuadorEgypt, Arab Rep.El SalvadorEquatorial GuineaEritreaEstoniaEthiopiaEuro areaEurope & Central AsiaEurope & Central Asia (excluding high income)Europe & Central Asia (IDA & IBRD countries)European UnionFaroe IslandsFijiFinlandFragile and conflict affected situationsFranceFrench PolynesiaGabonGambia, TheGeorgiaGermanyGhanaGreeceGrenadaGuatemalaGuineaGuinea-BissauGuyanaHaitiHeavily indebted poor countries (HIPC)High incomeHondurasHong Kong SAR, ChinaHungaryIBRD onlyIcelandIDA & IBRD totalIDA blendIDA onlyIDA totalIndiaIndonesiaIran, Islamic Rep.IraqIrelandIsraelItalyJamaicaJapanJordanKazakhstanKenyaKiribatiKorea, Rep.KosovoKuwaitKyrgyz RepublicLao PDRLate-demographic dividendLatin America & Caribbean Latin America & Caribbean (excluding high income)Latin America & the Caribbean (IDA & IBRD countries)LatviaLeast developed countries: UN classificationLebanonLesothoLiberiaLibyaLithuaniaLow & middle incomeLow incomeLower middle incomeLuxembourgMacao SAR, ChinaMacedonia, FYRMadagascarMalawiMalaysiaMaldivesMaliMaltaMauritaniaMauritiusMexicoMicronesia, Fed. Sts.Middle East & North AfricaMiddle East & North Africa (excluding high income)Middle East & North Africa (IDA & IBRD countries)Middle incomeMoldovaMongoliaMontenegroMoroccoMozambiqueMyanmarNamibiaNepalNetherlandsNew CaledoniaNew ZealandNicaraguaNigerNigeriaNorth AmericaNorwayOECD membersOmanOther small statesPacific island small statesPakistanPalauPanamaPapua New GuineaParaguayPeruPhilippinesPolandPortugalPost-demographic dividendPre-demographic dividendPuerto RicoQatarRomaniaRussian FederationRwandaSamoaSaudi ArabiaSenegalSerbiaSeychellesSierra LeoneSingaporeSlovak RepublicSloveniaSmall statesSolomon IslandsSomaliaSouth AfricaSouth AsiaSouth Asia (IDA & IBRD)South SudanSpainSri LankaSt. Kitts and NevisSt. LuciaSt. Vincent and the GrenadinesSub-Saharan Africa Sub-Saharan Africa (excluding high income)Sub-Saharan Africa (IDA & IBRD countries)SudanSurinameSwazilandSwedenSwitzerlandSyrian Arab RepublicTajikistanTanzaniaThailandTimor-LesteTogoTongaTrinidad and TobagoTunisiaTurkeyTurkmenistanUgandaUkraineUnited Arab EmiratesUnited KingdomUnited StatesUpper middle incomeUruguayUzbekistanVanuatuVenezuela, RBVietnamWest Bank and GazaWorldYemen, Rep.ZambiaZimbabwe Timeline:
This timeline shows a graph from 1961 to 2016 of Morocco. No data until 1960. Number of actual observations by date: 56.
Source name:
World Development Indicators
Source organization:
World Bank national accounts data, and OECD National Accounts data files.
Categories, topics:
Economy & Growth, Trade
Last updated:
apr 23, 2017
Indicators value changes by year
Minimum:
-20.425
jan 1, 1978
At the date of observation
Value
Absolute change
Change from previous value
jan 1, 1961
0.873
+0.873
0.0%
jan 1, 1962
-3.024
-3.897
-446.39%
jan 1, 1963
-3.073
-0.048
1.6%
jan 1, 1964
-2.157
+0.916
-29.81%
jan 1, 1965
0.353
+2.51
-116.37%
jan 1, 1966
1.273
+0.92
260.67%
jan 1, 1967
-0.412
-1.686
-132.37%
jan 1, 1968
-2.27
-1.858
450.79%
jan 1, 1969
-1.571
+0.7
-30.83%
jan 1, 1970
-0.455
+1.116
-71.06%
jan 1, 1971
-3.942
-3.488
767.27%
jan 1, 1972
-2.773
+1.17
-29.67%
jan 1, 1973
-0.649
+2.124
-76.59%
jan 1, 1974
-1.269
-0.62
95.59%
jan 1, 1975
-0.636
+0.633
-49.9%
jan 1, 1976
-10.873
-10.237
1.61K%
jan 1, 1977
-18.814
-7.941
73.04%
jan 1, 1978
-20.425
-1.611
8.56%
jan 1, 1979
-13.697
+6.728
-32.94%
jan 1, 1980
-12.854
+0.843
-6.15%
jan 1, 1981
-8.67
+4.184
-32.55%
jan 1, 1982
-12.094
-3.423
39.49%
jan 1, 1983
-12.131
-0.037
0.31%
jan 1, 1984
-7.105
+5.026
-41.43%
jan 1, 1985
-9.094
-1.99
28.0%
jan 1, 1986
-8.289
+0.806
-8.86%
jan 1, 1987
-6.516
+1.773
-21.39%
jan 1, 1988
-4.695
+1.821
-27.95%
jan 1, 1989
-0.145
+4.55
-96.92%
jan 1, 1990
-5.241
-5.096
3.53K%
jan 1, 1991
-5.508
-0.267
5.1%
jan 1, 1992
-5.142
+0.366
-6.65%
jan 1, 1993
-5.919
-0.777
15.12%
jan 1, 1994
-5.547
+0.372
-6.29%
jan 1, 1995
-5.437
+0.11
-1.99%
jan 1, 1996
-6.369
-0.932
17.14%
jan 1, 1997
-3.424
+2.945
-46.24%
jan 1, 1998
-3.302
+0.122
-3.55%
jan 1, 1999
-3.99
-0.688
20.84%
jan 1, 2000
-3.678
+0.312
-7.82%
jan 1, 2001
-5.587
-1.909
51.91%
jan 1, 2002
-3.0
+2.587
-46.31%
jan 1, 2003
-2.699
+0.301
-10.03%
jan 1, 2004
-3.32
-0.621
23.02%
jan 1, 2005
-5.381
-2.061
62.08%
jan 1, 2006
-6.077
-0.695
12.92%
jan 1, 2007
-5.986
+0.091
-1.5%
jan 1, 2008
-9.344
-3.358
56.11%
jan 1, 2009
-14.188
-4.844
51.85%
jan 1, 2010
-11.909
+2.279
-16.07%
jan 1, 2011
-10.782
+1.127
-9.46%
jan 1, 2012
-14.027
-3.245
30.1%
jan 1, 2013
-15.266
-1.239
8.83%
jan 1, 2014
-14.465
+0.801
-5.24%
jan 1, 2015
-12.512
+1.953
-13.5%
jan 1, 2016
-7.791
+4.721
-37.73%
Ranking of countries by current statistics by years


Comments: