29
/
en
AIzaSyAYiBZKx7MnpbEhh9jyipgxe19OcubqV5w
April 1, 2024
48085
Middle East & North Africa
MEA
false
2
1
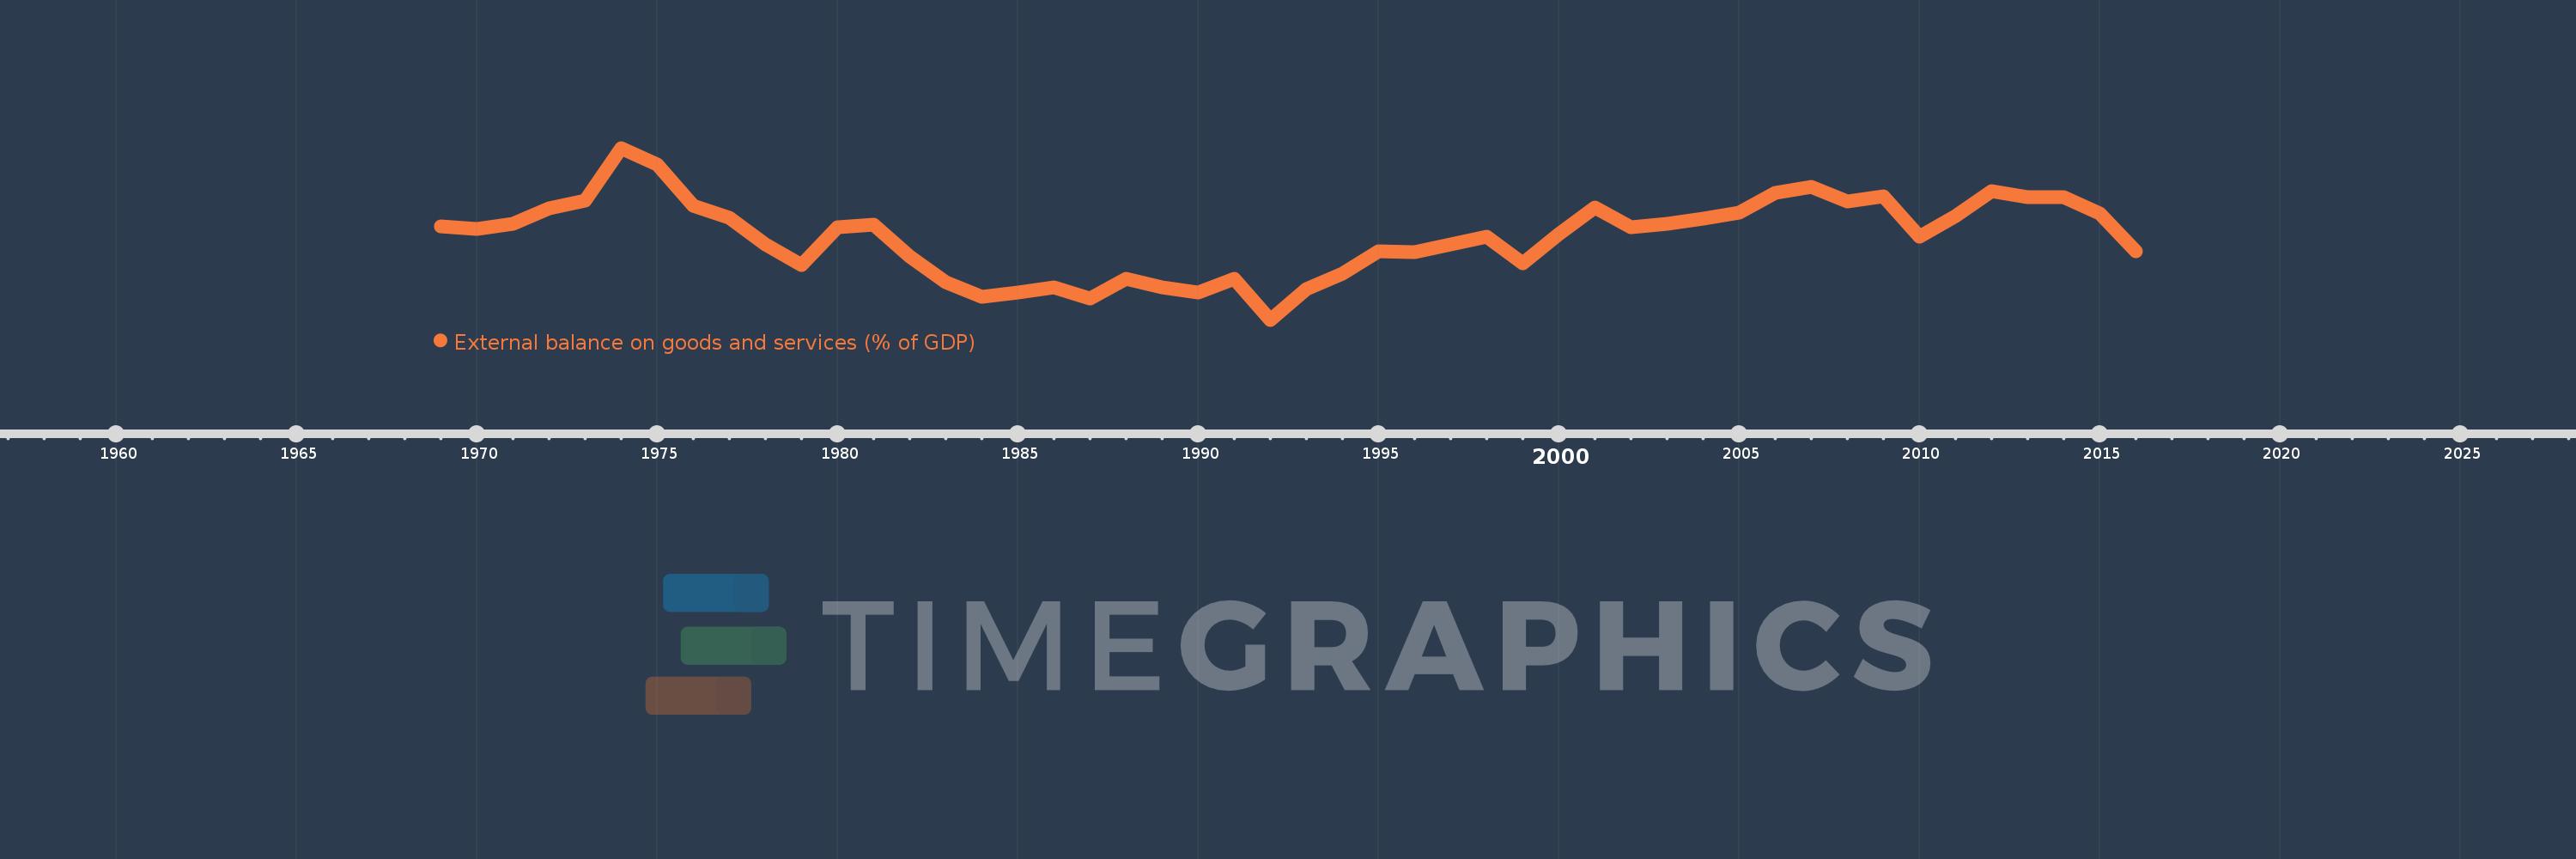
External balance on goods and services (% of GDP)
2016,2015,2014,2013,2012,2011,2010,2009,2008,2007,2006,2005,2004,2003,2002,2001,2000,1999,1998,1997,1996,1995,1994,1993,1992,1991,1990,1989,1988,1987,1986,1985,1984,1983,1982,1981,1980,1979,1978,1977,1976,1975,1974,1973,1972,1971,1970,1969
This statistics in other country:
AfghanistanAlbaniaAlgeriaAngolaAntigua and BarbudaArab WorldArgentinaArmeniaArubaAustraliaAustriaAzerbaijanBahamas, TheBahrainBangladeshBarbadosBelarusBelgiumBelizeBeninBermudaBhutanBoliviaBosnia and HerzegovinaBotswanaBrazilBrunei DarussalamBulgariaBurkina FasoBurundiCabo VerdeCambodiaCameroonCanadaCaribbean small statesCentral African RepublicCentral Europe and the BalticsChadChileChinaColombiaComorosCongo, Dem. Rep.Congo, Rep.Costa RicaCote d'IvoireCroatiaCubaCyprusCzech RepublicDenmarkDjiboutiDominicaDominican RepublicEarly-demographic dividendEast Asia & PacificEast Asia & Pacific (excluding high income)East Asia & Pacific (IDA & IBRD countries)EcuadorEgypt, Arab Rep.El SalvadorEquatorial GuineaEritreaEstoniaEthiopiaEuro areaEurope & Central AsiaEurope & Central Asia (excluding high income)Europe & Central Asia (IDA & IBRD countries)European UnionFaroe IslandsFijiFinlandFragile and conflict affected situationsFranceFrench PolynesiaGabonGambia, TheGeorgiaGermanyGhanaGreeceGrenadaGuatemalaGuineaGuinea-BissauGuyanaHaitiHeavily indebted poor countries (HIPC)High incomeHondurasHong Kong SAR, ChinaHungaryIBRD onlyIcelandIDA & IBRD totalIDA blendIDA onlyIDA totalIndiaIndonesiaIran, Islamic Rep.IraqIrelandIsraelItalyJamaicaJapanJordanKazakhstanKenyaKiribatiKorea, Rep.KosovoKuwaitKyrgyz RepublicLao PDRLate-demographic dividendLatin America & Caribbean Latin America & Caribbean (excluding high income)Latin America & the Caribbean (IDA & IBRD countries)LatviaLeast developed countries: UN classificationLebanonLesothoLiberiaLibyaLithuaniaLow & middle incomeLow incomeLower middle incomeLuxembourgMacao SAR, ChinaMacedonia, FYRMadagascarMalawiMalaysiaMaldivesMaliMaltaMauritaniaMauritiusMexicoMicronesia, Fed. Sts.Middle East & North AfricaMiddle East & North Africa (excluding high income)Middle East & North Africa (IDA & IBRD countries)Middle incomeMoldovaMongoliaMontenegroMoroccoMozambiqueMyanmarNamibiaNepalNetherlandsNew CaledoniaNew ZealandNicaraguaNigerNigeriaNorth AmericaNorwayOECD membersOmanOther small statesPacific island small statesPakistanPalauPanamaPapua New GuineaParaguayPeruPhilippinesPolandPortugalPost-demographic dividendPre-demographic dividendPuerto RicoQatarRomaniaRussian FederationRwandaSamoaSaudi ArabiaSenegalSerbiaSeychellesSierra LeoneSingaporeSlovak RepublicSloveniaSmall statesSolomon IslandsSomaliaSouth AfricaSouth AsiaSouth Asia (IDA & IBRD)South SudanSpainSri LankaSt. Kitts and NevisSt. LuciaSt. Vincent and the GrenadinesSub-Saharan Africa Sub-Saharan Africa (excluding high income)Sub-Saharan Africa (IDA & IBRD countries)SudanSurinameSwazilandSwedenSwitzerlandSyrian Arab RepublicTajikistanTanzaniaThailandTimor-LesteTogoTongaTrinidad and TobagoTunisiaTurkeyTurkmenistanUgandaUkraineUnited Arab EmiratesUnited KingdomUnited StatesUpper middle incomeUruguayUzbekistanVanuatuVenezuela, RBVietnamWest Bank and GazaWorldYemen, Rep.ZambiaZimbabwe Timeline:
This timeline shows a graph from 1969 to 2016 of Middle East & North Africa. No data until 1968. Number of actual observations by date: 48.
Source name:
World Development Indicators
Source organization:
World Bank national accounts data, and OECD National Accounts data files.
Categories, topics:
Economy & Growth, Trade
Last updated:
apr 23, 2017
Indicators value changes by year
Minimum:
-12.855
jan 1, 1992
Maximum:
23.288
jan 1, 1974
At the date of observation
Value
Absolute change
Change from previous value
jan 1, 1969
6.782
+6.782
0.0%
jan 1, 1970
6.315
-0.467
-6.88%
jan 1, 1971
7.282
+0.967
15.31%
jan 1, 1972
10.539
+3.257
44.72%
jan 1, 1973
12.23
+1.691
16.05%
jan 1, 1974
23.288
+11.058
90.41%
jan 1, 1975
19.724
-3.564
-15.31%
jan 1, 1976
11.064
-8.659
-43.9%
jan 1, 1977
8.647
-2.418
-21.85%
jan 1, 1978
3.03
-5.616
-64.95%
jan 1, 1979
-1.326
-4.356
-143.76%
jan 1, 1980
6.678
+8.004
-603.61%
jan 1, 1981
7.067
+0.389
5.83%
jan 1, 1982
0.497
-6.57
-92.97%
jan 1, 1983
-4.992
-5.488
-1.1K%
jan 1, 1984
-8.065
-3.073
61.57%
jan 1, 1985
-7.177
+0.888
-11.01%
jan 1, 1986
-6.117
+1.059
-14.76%
jan 1, 1987
-8.429
-2.312
37.79%
jan 1, 1988
-4.164
+4.266
-50.61%
jan 1, 1989
-6.081
-1.918
46.06%
jan 1, 1990
-7.145
-1.063
17.49%
jan 1, 1991
-4.191
+2.954
-41.35%
jan 1, 1992
-12.855
-8.665
206.77%
jan 1, 1993
-6.464
+6.391
-49.72%
jan 1, 1994
-3.123
+3.341
-51.68%
jan 1, 1995
1.58
+4.703
-150.59%
jan 1, 1996
1.414
-0.166
-10.51%
jan 1, 1997
3.035
+1.621
114.64%
jan 1, 1998
4.684
+1.649
54.34%
jan 1, 1999
-1.045
-5.729
-122.31%
jan 1, 2000
5.12
+6.165
-589.97%
jan 1, 2001
10.841
+5.722
111.76%
jan 1, 2002
6.666
-4.175
-38.51%
jan 1, 2003
7.299
+0.633
9.5%
jan 1, 2004
8.436
+1.136
15.57%
jan 1, 2005
9.728
+1.293
15.32%
jan 1, 2006
13.784
+4.055
41.69%
jan 1, 2007
15.035
+1.252
9.08%
jan 1, 2008
12.053
-2.983
-19.84%
jan 1, 2009
13.03
+0.978
8.11%
jan 1, 2010
4.551
-8.479
-65.07%
jan 1, 2011
8.99
+4.439
97.53%
jan 1, 2012
14.186
+5.196
57.79%
jan 1, 2013
12.863
-1.323
-9.33%
jan 1, 2014
12.87
+0.007
0.06%
jan 1, 2015
9.571
-3.299
-25.63%
jan 1, 2016
1.632
-7.939
-82.95%
Ranking of countries by current statistics by years


Comments: