29
/
en
AIzaSyAYiBZKx7MnpbEhh9jyipgxe19OcubqV5w
April 1, 2024
123428
Ecuador
ECU
true
2
1
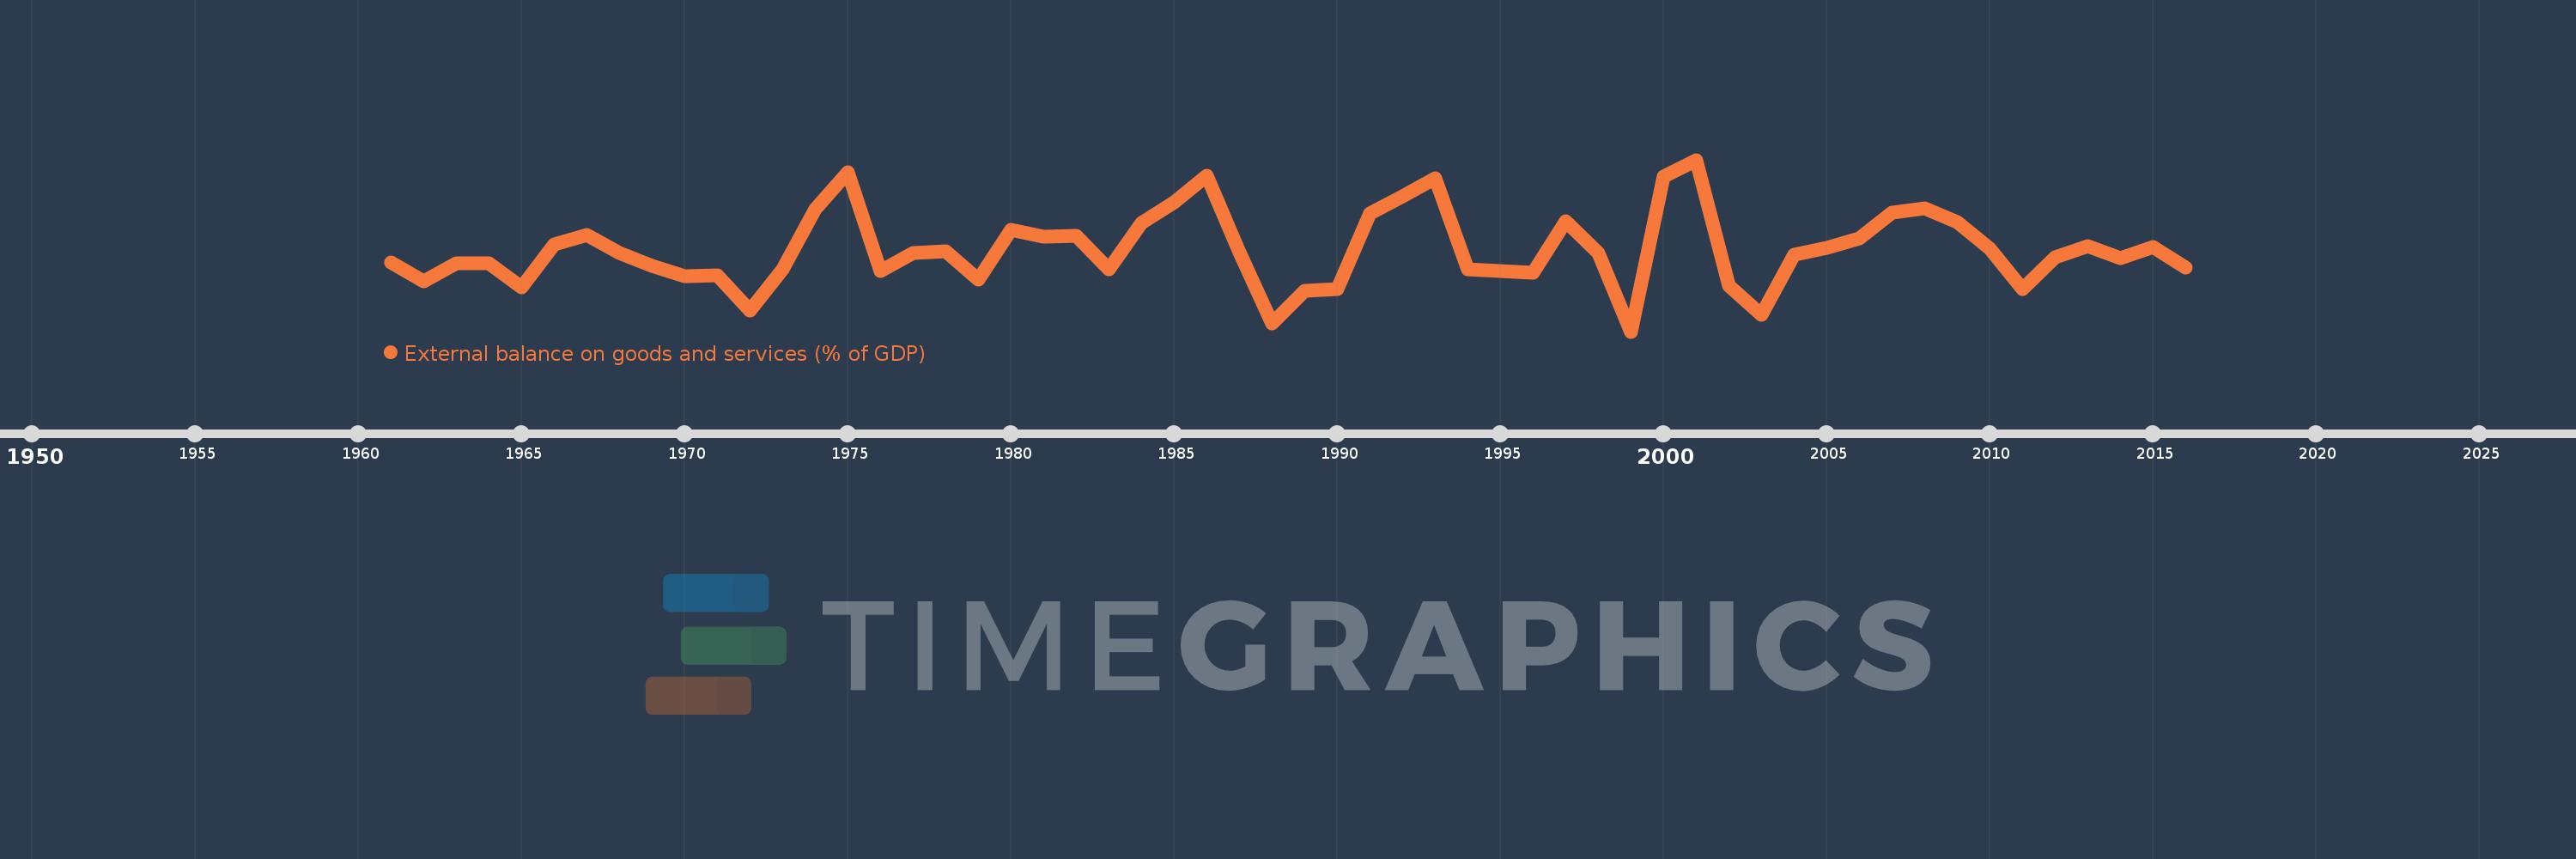
External balance on goods and services (% of GDP)
2016,2015,2014,2013,2012,2011,2010,2009,2008,2007,2006,2005,2004,2003,2002,2001,2000,1999,1998,1997,1996,1995,1994,1993,1992,1991,1990,1989,1988,1987,1986,1985,1984,1983,1982,1981,1980,1979,1978,1977,1976,1975,1974,1973,1972,1971,1970,1969,1968,1967,1966,1965,1964,1963,1962,1961
This statistics in other country:
AfghanistanAlbaniaAlgeriaAngolaAntigua and BarbudaArab WorldArgentinaArmeniaArubaAustraliaAustriaAzerbaijanBahamas, TheBahrainBangladeshBarbadosBelarusBelgiumBelizeBeninBermudaBhutanBoliviaBosnia and HerzegovinaBotswanaBrazilBrunei DarussalamBulgariaBurkina FasoBurundiCabo VerdeCambodiaCameroonCanadaCaribbean small statesCentral African RepublicCentral Europe and the BalticsChadChileChinaColombiaComorosCongo, Dem. Rep.Congo, Rep.Costa RicaCote d'IvoireCroatiaCubaCyprusCzech RepublicDenmarkDjiboutiDominicaDominican RepublicEarly-demographic dividendEast Asia & PacificEast Asia & Pacific (excluding high income)East Asia & Pacific (IDA & IBRD countries)EcuadorEgypt, Arab Rep.El SalvadorEquatorial GuineaEritreaEstoniaEthiopiaEuro areaEurope & Central AsiaEurope & Central Asia (excluding high income)Europe & Central Asia (IDA & IBRD countries)European UnionFaroe IslandsFijiFinlandFragile and conflict affected situationsFranceFrench PolynesiaGabonGambia, TheGeorgiaGermanyGhanaGreeceGrenadaGuatemalaGuineaGuinea-BissauGuyanaHaitiHeavily indebted poor countries (HIPC)High incomeHondurasHong Kong SAR, ChinaHungaryIBRD onlyIcelandIDA & IBRD totalIDA blendIDA onlyIDA totalIndiaIndonesiaIran, Islamic Rep.IraqIrelandIsraelItalyJamaicaJapanJordanKazakhstanKenyaKiribatiKorea, Rep.KosovoKuwaitKyrgyz RepublicLao PDRLate-demographic dividendLatin America & Caribbean Latin America & Caribbean (excluding high income)Latin America & the Caribbean (IDA & IBRD countries)LatviaLeast developed countries: UN classificationLebanonLesothoLiberiaLibyaLithuaniaLow & middle incomeLow incomeLower middle incomeLuxembourgMacao SAR, ChinaMacedonia, FYRMadagascarMalawiMalaysiaMaldivesMaliMaltaMauritaniaMauritiusMexicoMicronesia, Fed. Sts.Middle East & North AfricaMiddle East & North Africa (excluding high income)Middle East & North Africa (IDA & IBRD countries)Middle incomeMoldovaMongoliaMontenegroMoroccoMozambiqueMyanmarNamibiaNepalNetherlandsNew CaledoniaNew ZealandNicaraguaNigerNigeriaNorth AmericaNorwayOECD membersOmanOther small statesPacific island small statesPakistanPalauPanamaPapua New GuineaParaguayPeruPhilippinesPolandPortugalPost-demographic dividendPre-demographic dividendPuerto RicoQatarRomaniaRussian FederationRwandaSamoaSaudi ArabiaSenegalSerbiaSeychellesSierra LeoneSingaporeSlovak RepublicSloveniaSmall statesSolomon IslandsSomaliaSouth AfricaSouth AsiaSouth Asia (IDA & IBRD)South SudanSpainSri LankaSt. Kitts and NevisSt. LuciaSt. Vincent and the GrenadinesSub-Saharan Africa Sub-Saharan Africa (excluding high income)Sub-Saharan Africa (IDA & IBRD countries)SudanSurinameSwazilandSwedenSwitzerlandSyrian Arab RepublicTajikistanTanzaniaThailandTimor-LesteTogoTongaTrinidad and TobagoTunisiaTurkeyTurkmenistanUgandaUkraineUnited Arab EmiratesUnited KingdomUnited StatesUpper middle incomeUruguayUzbekistanVanuatuVenezuela, RBVietnamWest Bank and GazaWorldYemen, Rep.ZambiaZimbabwe Timeline:
This timeline shows a graph from 1961 to 2016 of Ecuador. No data until 1960. Number of actual observations by date: 56.
Source name:
World Development Indicators
Source organization:
World Bank national accounts data, and OECD National Accounts data files.
Categories, topics:
Economy & Growth, Trade
Last updated:
apr 23, 2017
Indicators value changes by year
Minimum:
-7.611
jan 1, 1999
At the date of observation
Value
Absolute change
Change from previous value
jan 1, 1961
-2.636
-2.636
0.0%
jan 1, 1962
-3.961
-1.325
50.26%
jan 1, 1963
-2.664
+1.297
-32.74%
jan 1, 1964
-2.664
+0.001
-0.02%
jan 1, 1965
-4.412
-1.748
65.64%
jan 1, 1966
-1.311
+3.101
-70.29%
jan 1, 1967
-0.629
+0.682
-52.04%
jan 1, 1968
-1.924
-1.296
206.11%
jan 1, 1969
-2.876
-0.952
49.45%
jan 1, 1970
-3.599
-0.723
25.15%
jan 1, 1971
-3.569
+0.031
-0.85%
jan 1, 1972
-6.11
-2.541
71.2%
jan 1, 1973
-3.142
+2.968
-48.57%
jan 1, 1974
1.218
+4.361
-138.78%
jan 1, 1975
3.9
+2.681
220.06%
jan 1, 1976
-3.263
-7.163
-183.68%
jan 1, 1977
-1.943
+1.321
-40.47%
jan 1, 1978
-1.836
+0.106
-5.47%
jan 1, 1979
-3.832
-1.995
108.66%
jan 1, 1980
-0.263
+3.568
-93.13%
jan 1, 1981
-0.729
-0.466
176.72%
jan 1, 1982
-0.68
+0.049
-6.77%
jan 1, 1983
-3.1
-2.42
356.16%
jan 1, 1984
0.243
+3.343
-107.85%
jan 1, 1985
1.695
+1.451
596.73%
jan 1, 1986
3.645
+1.951
115.13%
jan 1, 1987
-1.852
-5.497
-150.8%
jan 1, 1988
-6.999
-5.147
277.93%
jan 1, 1989
-4.651
+2.348
-33.55%
jan 1, 1990
-4.547
+0.104
-2.23%
jan 1, 1991
0.934
+5.481
-120.54%
jan 1, 1992
2.153
+1.219
130.5%
jan 1, 1993
3.461
+1.308
60.78%
jan 1, 1994
-3.1
-6.56
-189.56%
jan 1, 1995
-3.218
-0.119
3.83%
jan 1, 1996
-3.337
-0.119
3.71%
jan 1, 1997
0.331
+3.668
-109.91%
jan 1, 1998
-1.947
-2.278
-688.56%
jan 1, 1999
-7.611
-5.664
290.85%
jan 1, 2000
3.554
+11.165
-146.69%
jan 1, 2001
4.79
+1.237
34.79%
jan 1, 2002
-4.3
-9.09
-189.75%
jan 1, 2003
-6.392
-2.092
48.66%
jan 1, 2004
-2.045
+4.347
-68.01%
jan 1, 2005
-1.557
+0.488
-23.88%
jan 1, 2006
-0.863
+0.693
-44.53%
jan 1, 2007
0.956
+1.82
-210.76%
jan 1, 2008
1.276
+0.32
33.46%
jan 1, 2009
0.27
-1.006
-78.82%
jan 1, 2010
-1.607
-1.877
-694.32%
jan 1, 2011
-4.513
-2.907
180.92%
jan 1, 2012
-2.248
+2.265
-50.2%
jan 1, 2013
-1.421
+0.826
-36.76%
jan 1, 2014
-2.33
-0.908
63.88%
jan 1, 2015
-1.506
+0.824
-35.35%
jan 1, 2016
-2.987
-1.481
98.35%
Ranking of countries by current statistics by years


Comments: