29
/
en
AIzaSyAYiBZKx7MnpbEhh9jyipgxe19OcubqV5w
April 1, 2024
34924
Heavily indebted poor countries (HIPC)
HPC
false
2
1
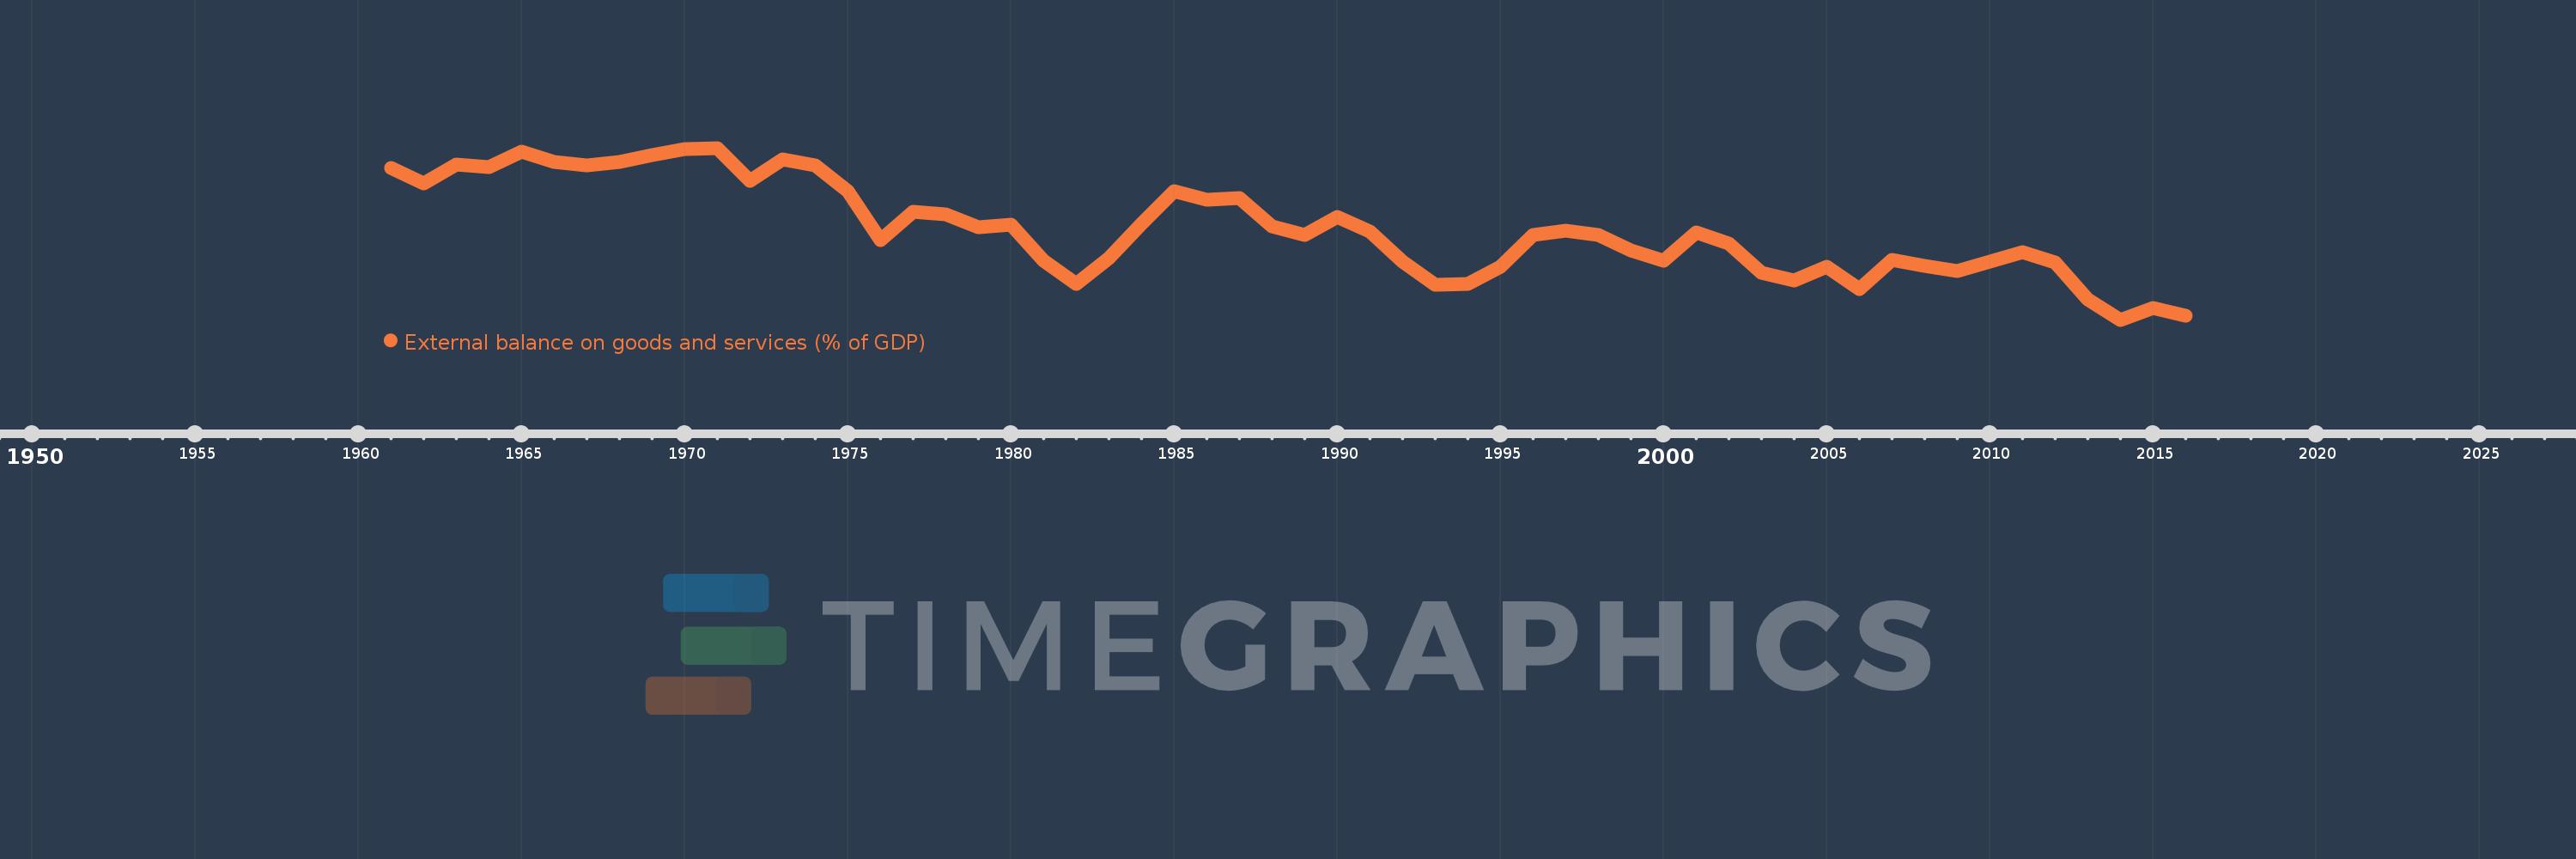
External balance on goods and services (% of GDP)
2016,2015,2014,2013,2012,2011,2010,2009,2008,2007,2006,2005,2004,2003,2002,2001,2000,1999,1998,1997,1996,1995,1994,1993,1992,1991,1990,1989,1988,1987,1986,1985,1984,1983,1982,1981,1980,1979,1978,1977,1976,1975,1974,1973,1972,1971,1970,1969,1968,1967,1966,1965,1964,1963,1962,1961
This statistics in other country:
AfghanistanAlbaniaAlgeriaAngolaAntigua and BarbudaArab WorldArgentinaArmeniaArubaAustraliaAustriaAzerbaijanBahamas, TheBahrainBangladeshBarbadosBelarusBelgiumBelizeBeninBermudaBhutanBoliviaBosnia and HerzegovinaBotswanaBrazilBrunei DarussalamBulgariaBurkina FasoBurundiCabo VerdeCambodiaCameroonCanadaCaribbean small statesCentral African RepublicCentral Europe and the BalticsChadChileChinaColombiaComorosCongo, Dem. Rep.Congo, Rep.Costa RicaCote d'IvoireCroatiaCubaCyprusCzech RepublicDenmarkDjiboutiDominicaDominican RepublicEarly-demographic dividendEast Asia & PacificEast Asia & Pacific (excluding high income)East Asia & Pacific (IDA & IBRD countries)EcuadorEgypt, Arab Rep.El SalvadorEquatorial GuineaEritreaEstoniaEthiopiaEuro areaEurope & Central AsiaEurope & Central Asia (excluding high income)Europe & Central Asia (IDA & IBRD countries)European UnionFaroe IslandsFijiFinlandFragile and conflict affected situationsFranceFrench PolynesiaGabonGambia, TheGeorgiaGermanyGhanaGreeceGrenadaGuatemalaGuineaGuinea-BissauGuyanaHaitiHeavily indebted poor countries (HIPC)High incomeHondurasHong Kong SAR, ChinaHungaryIBRD onlyIcelandIDA & IBRD totalIDA blendIDA onlyIDA totalIndiaIndonesiaIran, Islamic Rep.IraqIrelandIsraelItalyJamaicaJapanJordanKazakhstanKenyaKiribatiKorea, Rep.KosovoKuwaitKyrgyz RepublicLao PDRLate-demographic dividendLatin America & Caribbean Latin America & Caribbean (excluding high income)Latin America & the Caribbean (IDA & IBRD countries)LatviaLeast developed countries: UN classificationLebanonLesothoLiberiaLibyaLithuaniaLow & middle incomeLow incomeLower middle incomeLuxembourgMacao SAR, ChinaMacedonia, FYRMadagascarMalawiMalaysiaMaldivesMaliMaltaMauritaniaMauritiusMexicoMicronesia, Fed. Sts.Middle East & North AfricaMiddle East & North Africa (excluding high income)Middle East & North Africa (IDA & IBRD countries)Middle incomeMoldovaMongoliaMontenegroMoroccoMozambiqueMyanmarNamibiaNepalNetherlandsNew CaledoniaNew ZealandNicaraguaNigerNigeriaNorth AmericaNorwayOECD membersOmanOther small statesPacific island small statesPakistanPalauPanamaPapua New GuineaParaguayPeruPhilippinesPolandPortugalPost-demographic dividendPre-demographic dividendPuerto RicoQatarRomaniaRussian FederationRwandaSamoaSaudi ArabiaSenegalSerbiaSeychellesSierra LeoneSingaporeSlovak RepublicSloveniaSmall statesSolomon IslandsSomaliaSouth AfricaSouth AsiaSouth Asia (IDA & IBRD)South SudanSpainSri LankaSt. Kitts and NevisSt. LuciaSt. Vincent and the GrenadinesSub-Saharan Africa Sub-Saharan Africa (excluding high income)Sub-Saharan Africa (IDA & IBRD countries)SudanSurinameSwazilandSwedenSwitzerlandSyrian Arab RepublicTajikistanTanzaniaThailandTimor-LesteTogoTongaTrinidad and TobagoTunisiaTurkeyTurkmenistanUgandaUkraineUnited Arab EmiratesUnited KingdomUnited StatesUpper middle incomeUruguayUzbekistanVanuatuVenezuela, RBVietnamWest Bank and GazaWorldYemen, Rep.ZambiaZimbabwe Timeline:
This timeline shows a graph from 1961 to 2016 of Heavily indebted poor countries (HIPC). No data until 1960. Number of actual observations by date: 56.
Source name:
World Development Indicators
Source organization:
World Bank national accounts data, and OECD National Accounts data files.
Categories, topics:
Economy & Growth, Trade
Last updated:
apr 23, 2017
Indicators value changes by year
Minimum:
-12.698
jan 1, 2014
Maximum:
-1.816
jan 1, 1971
At the date of observation
Value
Absolute change
Change from previous value
jan 1, 1961
-3.091
-3.091
0.0%
jan 1, 1962
-4.079
-0.989
31.99%
jan 1, 1963
-2.841
+1.238
-30.36%
jan 1, 1964
-3.005
-0.164
5.77%
jan 1, 1965
-2.077
+0.928
-30.89%
jan 1, 1966
-2.692
-0.615
29.63%
jan 1, 1967
-2.945
-0.253
9.41%
jan 1, 1968
-2.711
+0.234
-7.95%
jan 1, 1969
-2.28
+0.431
-15.89%
jan 1, 1970
-1.891
+0.389
-17.06%
jan 1, 1971
-1.816
+0.076
-3.99%
jan 1, 1972
-3.923
-2.108
116.07%
jan 1, 1973
-2.519
+1.404
-35.79%
jan 1, 1974
-2.937
-0.417
16.57%
jan 1, 1975
-4.555
-1.618
55.1%
jan 1, 1976
-7.66
-3.105
68.18%
jan 1, 1977
-5.851
+1.808
-23.61%
jan 1, 1978
-6.045
-0.194
3.31%
jan 1, 1979
-6.845
-0.8
13.23%
jan 1, 1980
-6.68
+0.165
-2.4%
jan 1, 1981
-8.959
-2.279
34.11%
jan 1, 1982
-10.447
-1.488
16.61%
jan 1, 1983
-8.799
+1.649
-15.78%
jan 1, 1984
-6.609
+2.19
-24.89%
jan 1, 1985
-4.563
+2.045
-30.95%
jan 1, 1986
-5.111
-0.548
12.0%
jan 1, 1987
-4.978
+0.133
-2.6%
jan 1, 1988
-6.763
-1.785
35.85%
jan 1, 1989
-7.322
-0.559
8.27%
jan 1, 1990
-6.178
+1.144
-15.62%
jan 1, 1991
-7.098
-0.921
14.91%
jan 1, 1992
-9.012
-1.914
26.96%
jan 1, 1993
-10.461
-1.449
16.07%
jan 1, 1994
-10.423
+0.038
-0.36%
jan 1, 1995
-9.333
+1.09
-10.46%
jan 1, 1996
-7.321
+2.012
-21.56%
jan 1, 1997
-7.056
+0.265
-3.62%
jan 1, 1998
-7.303
-0.248
3.51%
jan 1, 1999
-8.316
-1.013
13.87%
jan 1, 2000
-8.96
-0.645
7.75%
jan 1, 2001
-7.154
+1.806
-20.16%
jan 1, 2002
-7.888
-0.734
10.26%
jan 1, 2003
-9.707
-1.819
23.06%
jan 1, 2004
-10.198
-0.491
5.06%
jan 1, 2005
-9.336
+0.863
-8.46%
jan 1, 2006
-10.751
-1.416
15.17%
jan 1, 2007
-8.9
+1.852
-17.22%
jan 1, 2008
-9.289
-0.389
4.37%
jan 1, 2009
-9.637
-0.348
3.75%
jan 1, 2010
-8.991
+0.646
-6.7%
jan 1, 2011
-8.397
+0.594
-6.61%
jan 1, 2012
-9.075
-0.678
8.08%
jan 1, 2013
-11.398
-2.323
25.59%
jan 1, 2014
-12.698
-1.3
11.41%
jan 1, 2015
-11.961
+0.737
-5.8%
jan 1, 2016
-12.42
-0.459
3.84%
Ranking of countries by current statistics by years


Comments: