29
/
en
AIzaSyAYiBZKx7MnpbEhh9jyipgxe19OcubqV5w
April 1, 2024
235702
Senegal
SEN
true
2
1
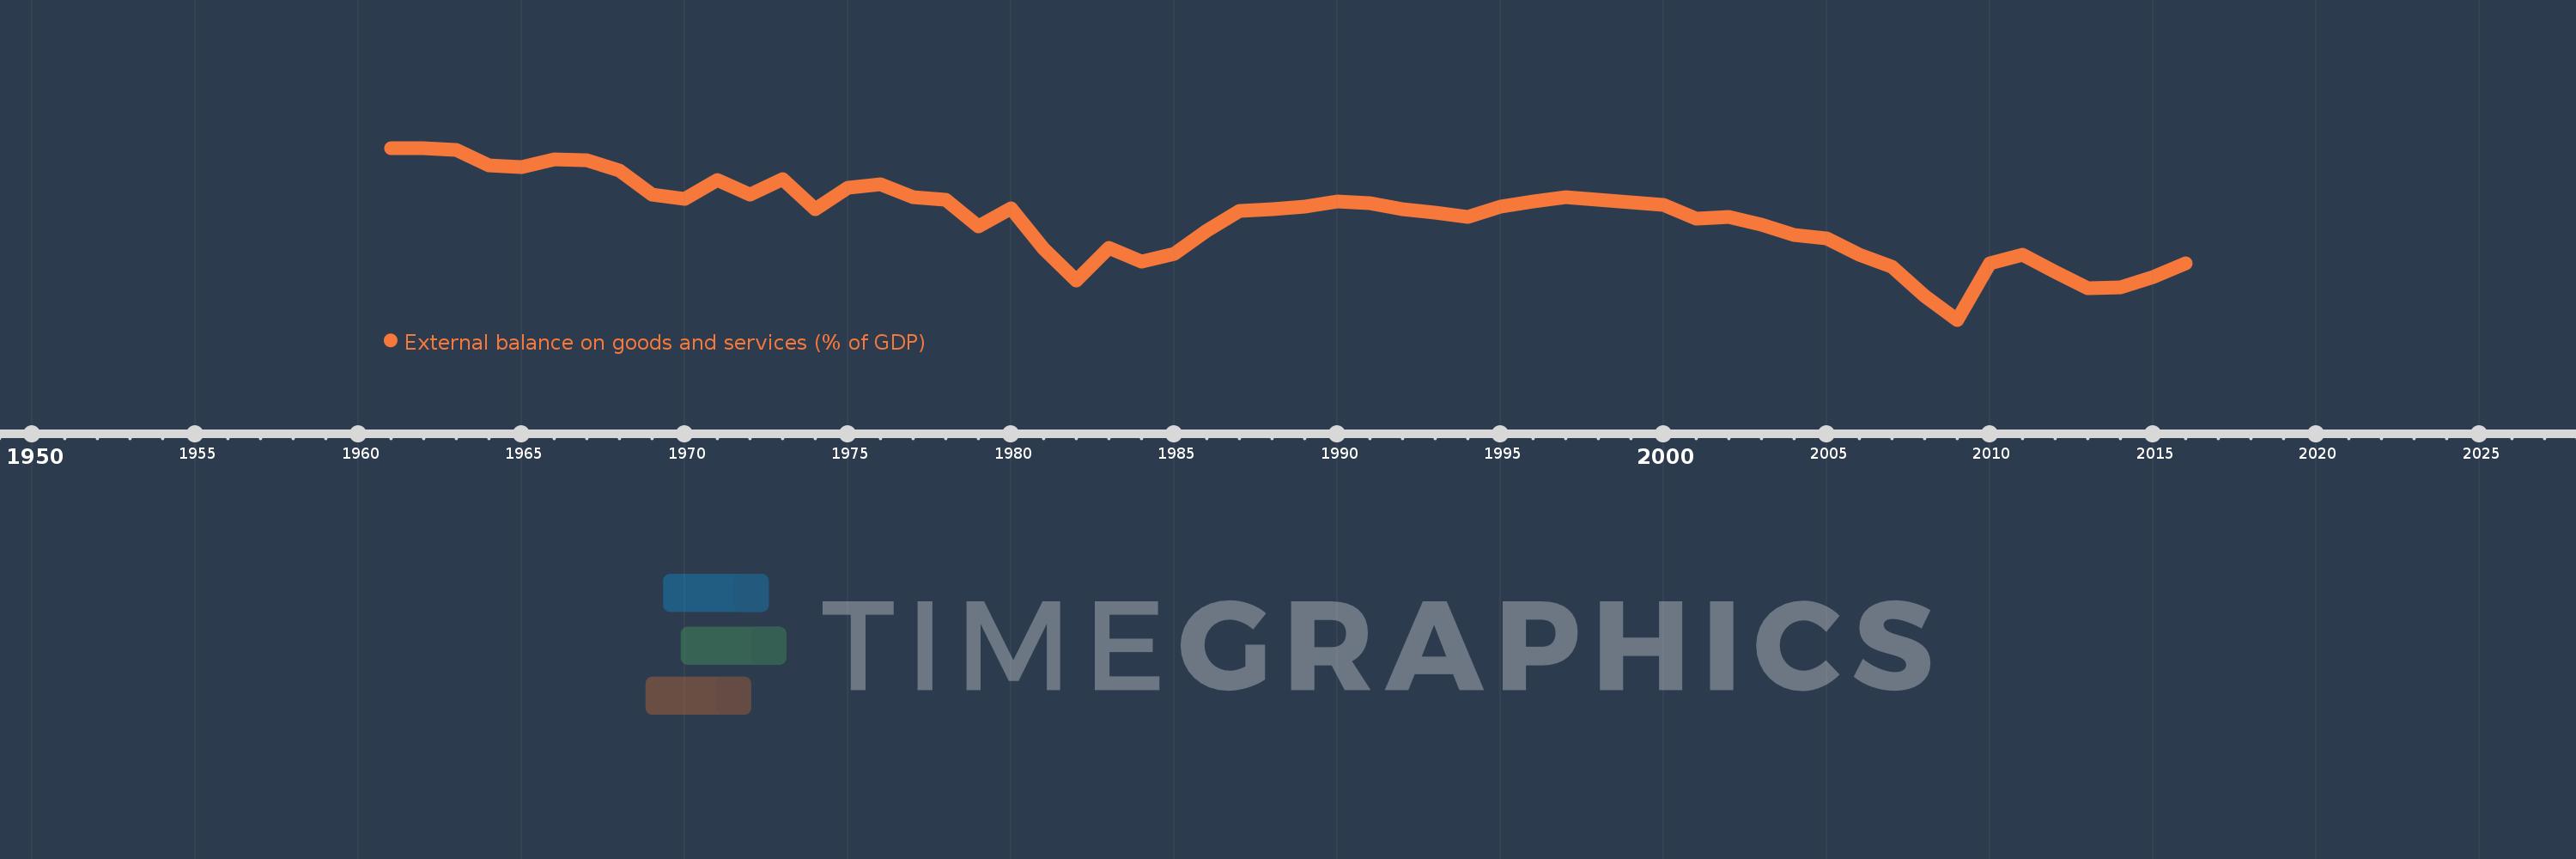
External balance on goods and services (% of GDP)
2016,2015,2014,2013,2012,2011,2010,2009,2008,2007,2006,2005,2004,2003,2002,2001,2000,1999,1998,1997,1996,1995,1994,1993,1992,1991,1990,1989,1988,1987,1986,1985,1984,1983,1982,1981,1980,1979,1978,1977,1976,1975,1974,1973,1972,1971,1970,1969,1968,1967,1966,1965,1964,1963,1962,1961
This statistics in other country:
AfghanistanAlbaniaAlgeriaAngolaAntigua and BarbudaArab WorldArgentinaArmeniaArubaAustraliaAustriaAzerbaijanBahamas, TheBahrainBangladeshBarbadosBelarusBelgiumBelizeBeninBermudaBhutanBoliviaBosnia and HerzegovinaBotswanaBrazilBrunei DarussalamBulgariaBurkina FasoBurundiCabo VerdeCambodiaCameroonCanadaCaribbean small statesCentral African RepublicCentral Europe and the BalticsChadChileChinaColombiaComorosCongo, Dem. Rep.Congo, Rep.Costa RicaCote d'IvoireCroatiaCubaCyprusCzech RepublicDenmarkDjiboutiDominicaDominican RepublicEarly-demographic dividendEast Asia & PacificEast Asia & Pacific (excluding high income)East Asia & Pacific (IDA & IBRD countries)EcuadorEgypt, Arab Rep.El SalvadorEquatorial GuineaEritreaEstoniaEthiopiaEuro areaEurope & Central AsiaEurope & Central Asia (excluding high income)Europe & Central Asia (IDA & IBRD countries)European UnionFaroe IslandsFijiFinlandFragile and conflict affected situationsFranceFrench PolynesiaGabonGambia, TheGeorgiaGermanyGhanaGreeceGrenadaGuatemalaGuineaGuinea-BissauGuyanaHaitiHeavily indebted poor countries (HIPC)High incomeHondurasHong Kong SAR, ChinaHungaryIBRD onlyIcelandIDA & IBRD totalIDA blendIDA onlyIDA totalIndiaIndonesiaIran, Islamic Rep.IraqIrelandIsraelItalyJamaicaJapanJordanKazakhstanKenyaKiribatiKorea, Rep.KosovoKuwaitKyrgyz RepublicLao PDRLate-demographic dividendLatin America & Caribbean Latin America & Caribbean (excluding high income)Latin America & the Caribbean (IDA & IBRD countries)LatviaLeast developed countries: UN classificationLebanonLesothoLiberiaLibyaLithuaniaLow & middle incomeLow incomeLower middle incomeLuxembourgMacao SAR, ChinaMacedonia, FYRMadagascarMalawiMalaysiaMaldivesMaliMaltaMauritaniaMauritiusMexicoMicronesia, Fed. Sts.Middle East & North AfricaMiddle East & North Africa (excluding high income)Middle East & North Africa (IDA & IBRD countries)Middle incomeMoldovaMongoliaMontenegroMoroccoMozambiqueMyanmarNamibiaNepalNetherlandsNew CaledoniaNew ZealandNicaraguaNigerNigeriaNorth AmericaNorwayOECD membersOmanOther small statesPacific island small statesPakistanPalauPanamaPapua New GuineaParaguayPeruPhilippinesPolandPortugalPost-demographic dividendPre-demographic dividendPuerto RicoQatarRomaniaRussian FederationRwandaSamoaSaudi ArabiaSenegalSerbiaSeychellesSierra LeoneSingaporeSlovak RepublicSloveniaSmall statesSolomon IslandsSomaliaSouth AfricaSouth AsiaSouth Asia (IDA & IBRD)South SudanSpainSri LankaSt. Kitts and NevisSt. LuciaSt. Vincent and the GrenadinesSub-Saharan Africa Sub-Saharan Africa (excluding high income)Sub-Saharan Africa (IDA & IBRD countries)SudanSurinameSwazilandSwedenSwitzerlandSyrian Arab RepublicTajikistanTanzaniaThailandTimor-LesteTogoTongaTrinidad and TobagoTunisiaTurkeyTurkmenistanUgandaUkraineUnited Arab EmiratesUnited KingdomUnited StatesUpper middle incomeUruguayUzbekistanVanuatuVenezuela, RBVietnamWest Bank and GazaWorldYemen, Rep.ZambiaZimbabwe Timeline:
This timeline shows a graph from 1961 to 2016 of Senegal. No data until 1960. Number of actual observations by date: 56.
Source name:
World Development Indicators
Source organization:
World Bank national accounts data, and OECD National Accounts data files.
Categories, topics:
Economy & Growth, Trade
Last updated:
apr 23, 2017
Indicators value changes by year
Minimum:
-26.322
jan 1, 2009
At the date of observation
Value
Absolute change
Change from previous value
jan 1, 1961
2.496
+2.496
0.0%
jan 1, 1962
2.429
-0.068
-2.72%
jan 1, 1963
2.188
-0.241
-9.91%
jan 1, 1964
-0.387
-2.575
-117.71%
jan 1, 1965
-0.755
-0.368
95.0%
jan 1, 1966
0.564
+1.319
-174.62%
jan 1, 1967
0.433
-0.131
-23.21%
jan 1, 1968
-1.286
-1.719
-397.19%
jan 1, 1969
-5.336
-4.049
314.77%
jan 1, 1970
-6.094
-0.759
14.22%
jan 1, 1971
-2.947
+3.147
-51.64%
jan 1, 1972
-5.315
-2.368
80.33%
jan 1, 1973
-2.788
+2.527
-47.55%
jan 1, 1974
-7.728
-4.94
177.22%
jan 1, 1975
-4.123
+3.604
-46.64%
jan 1, 1976
-3.601
+0.523
-12.68%
jan 1, 1977
-5.763
-2.162
60.05%
jan 1, 1978
-6.199
-0.436
7.57%
jan 1, 1979
-10.628
-4.429
71.45%
jan 1, 1980
-7.695
+2.933
-27.6%
jan 1, 1981
-14.458
-6.763
87.88%
jan 1, 1982
-19.788
-5.33
36.87%
jan 1, 1983
-14.253
+5.535
-27.97%
jan 1, 1984
-16.598
-2.345
16.45%
jan 1, 1985
-15.209
+1.389
-8.37%
jan 1, 1986
-11.398
+3.81
-25.05%
jan 1, 1987
-8.091
+3.307
-29.01%
jan 1, 1988
-7.708
+0.383
-4.73%
jan 1, 1989
-7.303
+0.405
-5.26%
jan 1, 1990
-6.445
+0.858
-11.75%
jan 1, 1991
-6.775
-0.33
5.12%
jan 1, 1992
-7.825
-1.05
15.5%
jan 1, 1993
-8.393
-0.568
7.26%
jan 1, 1994
-9.108
-0.716
8.53%
jan 1, 1995
-7.313
+1.795
-19.71%
jan 1, 1996
-6.461
+0.852
-11.65%
jan 1, 1997
-5.781
+0.681
-10.53%
jan 1, 1998
-6.237
-0.457
7.9%
jan 1, 1999
-6.566
-0.329
5.27%
jan 1, 2000
-6.998
-0.432
6.58%
jan 1, 2001
-9.292
-2.294
32.78%
jan 1, 2002
-9.038
+0.254
-2.73%
jan 1, 2003
-10.416
-1.378
15.25%
jan 1, 2004
-12.114
-1.697
16.29%
jan 1, 2005
-12.63
-0.516
4.26%
jan 1, 2006
-15.407
-2.777
21.99%
jan 1, 2007
-17.471
-2.064
13.4%
jan 1, 2008
-22.399
-4.928
28.2%
jan 1, 2009
-26.322
-3.923
17.51%
jan 1, 2010
-16.888
+9.434
-35.84%
jan 1, 2011
-15.402
+1.486
-8.8%
jan 1, 2012
-18.343
-2.941
19.09%
jan 1, 2013
-21.029
-2.686
14.64%
jan 1, 2014
-20.874
+0.155
-0.74%
jan 1, 2015
-19.172
+1.702
-8.15%
jan 1, 2016
-16.923
+2.249
-11.73%
Ranking of countries by current statistics by years


Comments: