29
/
en
AIzaSyAYiBZKx7MnpbEhh9jyipgxe19OcubqV5w
April 1, 2024
72926
Australia
AUS
true
2
1
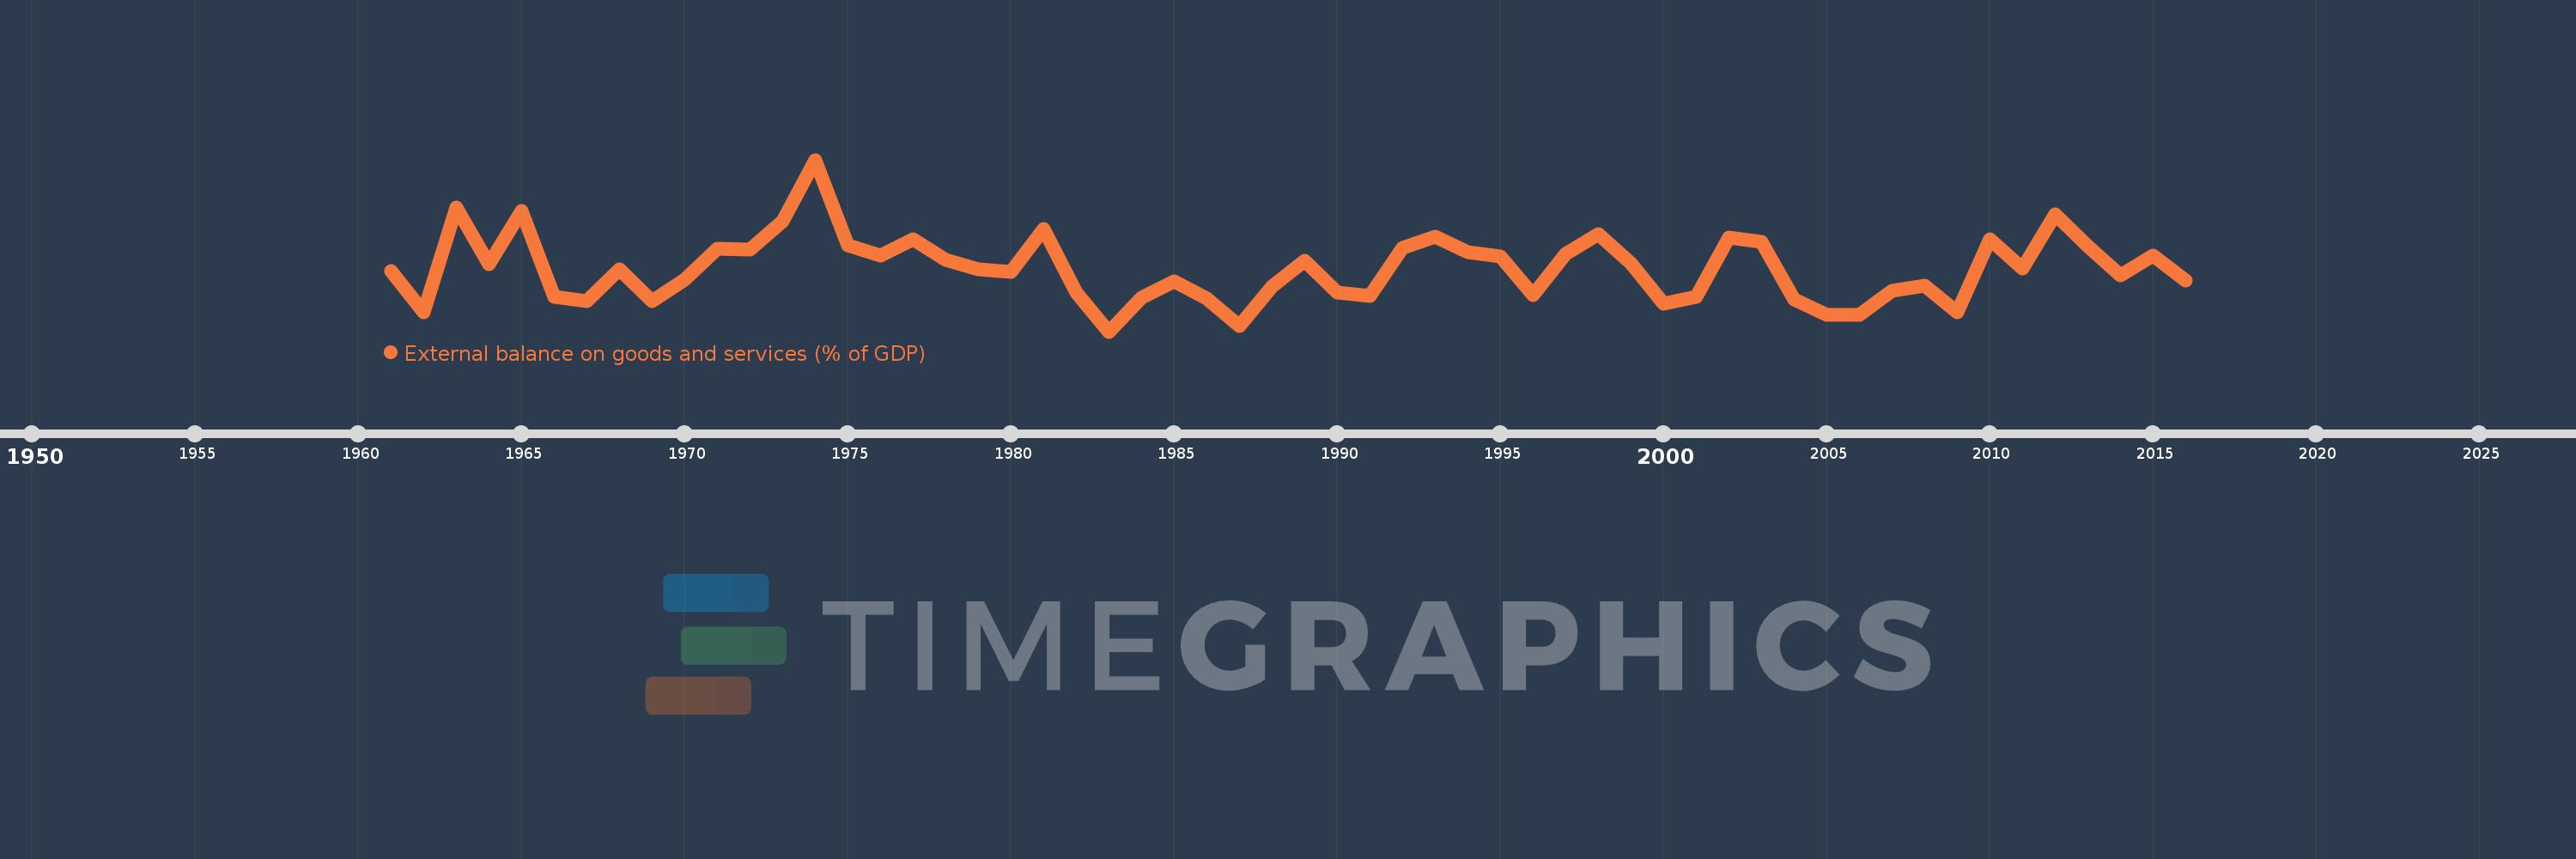
External balance on goods and services (% of GDP)
2016,2015,2014,2013,2012,2011,2010,2009,2008,2007,2006,2005,2004,2003,2002,2001,2000,1999,1998,1997,1996,1995,1994,1993,1992,1991,1990,1989,1988,1987,1986,1985,1984,1983,1982,1981,1980,1979,1978,1977,1976,1975,1974,1973,1972,1971,1970,1969,1968,1967,1966,1965,1964,1963,1962,1961
This statistics in other country:
AfghanistanAlbaniaAlgeriaAngolaAntigua and BarbudaArab WorldArgentinaArmeniaArubaAustraliaAustriaAzerbaijanBahamas, TheBahrainBangladeshBarbadosBelarusBelgiumBelizeBeninBermudaBhutanBoliviaBosnia and HerzegovinaBotswanaBrazilBrunei DarussalamBulgariaBurkina FasoBurundiCabo VerdeCambodiaCameroonCanadaCaribbean small statesCentral African RepublicCentral Europe and the BalticsChadChileChinaColombiaComorosCongo, Dem. Rep.Congo, Rep.Costa RicaCote d'IvoireCroatiaCubaCyprusCzech RepublicDenmarkDjiboutiDominicaDominican RepublicEarly-demographic dividendEast Asia & PacificEast Asia & Pacific (excluding high income)East Asia & Pacific (IDA & IBRD countries)EcuadorEgypt, Arab Rep.El SalvadorEquatorial GuineaEritreaEstoniaEthiopiaEuro areaEurope & Central AsiaEurope & Central Asia (excluding high income)Europe & Central Asia (IDA & IBRD countries)European UnionFaroe IslandsFijiFinlandFragile and conflict affected situationsFranceFrench PolynesiaGabonGambia, TheGeorgiaGermanyGhanaGreeceGrenadaGuatemalaGuineaGuinea-BissauGuyanaHaitiHeavily indebted poor countries (HIPC)High incomeHondurasHong Kong SAR, ChinaHungaryIBRD onlyIcelandIDA & IBRD totalIDA blendIDA onlyIDA totalIndiaIndonesiaIran, Islamic Rep.IraqIrelandIsraelItalyJamaicaJapanJordanKazakhstanKenyaKiribatiKorea, Rep.KosovoKuwaitKyrgyz RepublicLao PDRLate-demographic dividendLatin America & Caribbean Latin America & Caribbean (excluding high income)Latin America & the Caribbean (IDA & IBRD countries)LatviaLeast developed countries: UN classificationLebanonLesothoLiberiaLibyaLithuaniaLow & middle incomeLow incomeLower middle incomeLuxembourgMacao SAR, ChinaMacedonia, FYRMadagascarMalawiMalaysiaMaldivesMaliMaltaMauritaniaMauritiusMexicoMicronesia, Fed. Sts.Middle East & North AfricaMiddle East & North Africa (excluding high income)Middle East & North Africa (IDA & IBRD countries)Middle incomeMoldovaMongoliaMontenegroMoroccoMozambiqueMyanmarNamibiaNepalNetherlandsNew CaledoniaNew ZealandNicaraguaNigerNigeriaNorth AmericaNorwayOECD membersOmanOther small statesPacific island small statesPakistanPalauPanamaPapua New GuineaParaguayPeruPhilippinesPolandPortugalPost-demographic dividendPre-demographic dividendPuerto RicoQatarRomaniaRussian FederationRwandaSamoaSaudi ArabiaSenegalSerbiaSeychellesSierra LeoneSingaporeSlovak RepublicSloveniaSmall statesSolomon IslandsSomaliaSouth AfricaSouth AsiaSouth Asia (IDA & IBRD)South SudanSpainSri LankaSt. Kitts and NevisSt. LuciaSt. Vincent and the GrenadinesSub-Saharan Africa Sub-Saharan Africa (excluding high income)Sub-Saharan Africa (IDA & IBRD countries)SudanSurinameSwazilandSwedenSwitzerlandSyrian Arab RepublicTajikistanTanzaniaThailandTimor-LesteTogoTongaTrinidad and TobagoTunisiaTurkeyTurkmenistanUgandaUkraineUnited Arab EmiratesUnited KingdomUnited StatesUpper middle incomeUruguayUzbekistanVanuatuVenezuela, RBVietnamWest Bank and GazaWorldYemen, Rep.ZambiaZimbabwe Timeline:
This timeline shows a graph from 1961 to 2016 of Australia. No data until 1960. Number of actual observations by date: 56.
Source name:
World Development Indicators
Source organization:
World Bank national accounts data, and OECD National Accounts data files.
Categories, topics:
Economy & Growth, Trade
Last updated:
apr 23, 2017
Indicators value changes by year
Minimum:
-3.333
jan 1, 1983
At the date of observation
Value
Absolute change
Change from previous value
jan 1, 1961
-1.068
-1.068
0.0%
jan 1, 1962
-2.623
-1.556
145.7%
jan 1, 1963
1.312
+3.936
-150.03%
jan 1, 1964
-0.828
-2.141
-163.12%
jan 1, 1965
1.174
+2.002
-241.73%
jan 1, 1966
-2.048
-3.222
-274.42%
jan 1, 1967
-2.199
-0.151
7.38%
jan 1, 1968
-1.01
+1.189
-54.06%
jan 1, 1969
-2.189
-1.179
116.7%
jan 1, 1970
-1.38
+0.809
-36.97%
jan 1, 1971
-0.244
+1.135
-82.29%
jan 1, 1972
-0.276
-0.031
12.74%
jan 1, 1973
0.794
+1.07
-388.23%
jan 1, 1974
3.074
+2.28
287.08%
jan 1, 1975
-0.118
-3.192
-103.83%
jan 1, 1976
-0.492
-0.374
317.66%
jan 1, 1977
0.108
+0.601
-121.99%
jan 1, 1978
-0.664
-0.772
-713.15%
jan 1, 1979
-0.999
-0.335
50.52%
jan 1, 1980
-1.091
-0.092
9.17%
jan 1, 1981
0.483
+1.574
-144.31%
jan 1, 1982
-1.873
-2.356
-487.66%
jan 1, 1983
-3.333
-1.459
77.92%
jan 1, 1984
-2.072
+1.26
-37.82%
jan 1, 1985
-1.465
+0.607
-29.29%
jan 1, 1986
-2.086
-0.621
42.38%
jan 1, 1987
-3.109
-1.023
49.02%
jan 1, 1988
-1.636
+1.473
-47.39%
jan 1, 1989
-0.696
+0.94
-57.44%
jan 1, 1990
-1.88
-1.183
169.98%
jan 1, 1991
-1.988
-0.109
5.78%
jan 1, 1992
-0.197
+1.791
-90.08%
jan 1, 1993
0.203
+0.4
-202.88%
jan 1, 1994
-0.376
-0.579
-285.41%
jan 1, 1995
-0.533
-0.156
41.58%
jan 1, 1996
-1.969
-1.436
269.63%
jan 1, 1997
-0.437
+1.531
-77.78%
jan 1, 1998
0.311
+0.748
-171.05%
jan 1, 1999
-0.784
-1.095
-352.27%
jan 1, 2000
-2.288
-1.504
191.77%
jan 1, 2001
-2.032
+0.256
-11.17%
jan 1, 2002
0.176
+2.209
-108.67%
jan 1, 2003
0.023
-0.153
-86.82%
jan 1, 2004
-2.123
-2.147
-9.24K%
jan 1, 2005
-2.701
-0.578
27.21%
jan 1, 2006
-2.716
-0.015
0.56%
jan 1, 2007
-1.808
+0.908
-33.44%
jan 1, 2008
-1.611
+0.197
-10.92%
jan 1, 2009
-2.601
-0.99
61.48%
jan 1, 2010
0.102
+2.703
-103.92%
jan 1, 2011
-0.972
-1.074
-1.05K%
jan 1, 2012
1.04
+2.011
-206.99%
jan 1, 2013
-0.137
-1.176
-113.16%
jan 1, 2014
-1.23
-1.094
799.75%
jan 1, 2015
-0.494
+0.737
-59.89%
jan 1, 2016
-1.412
-0.918
186.07%
Ranking of countries by current statistics by years


Comments: