29
/
en
AIzaSyAYiBZKx7MnpbEhh9jyipgxe19OcubqV5w
April 1, 2024
158399
Iraq
IRQ
true
2
1
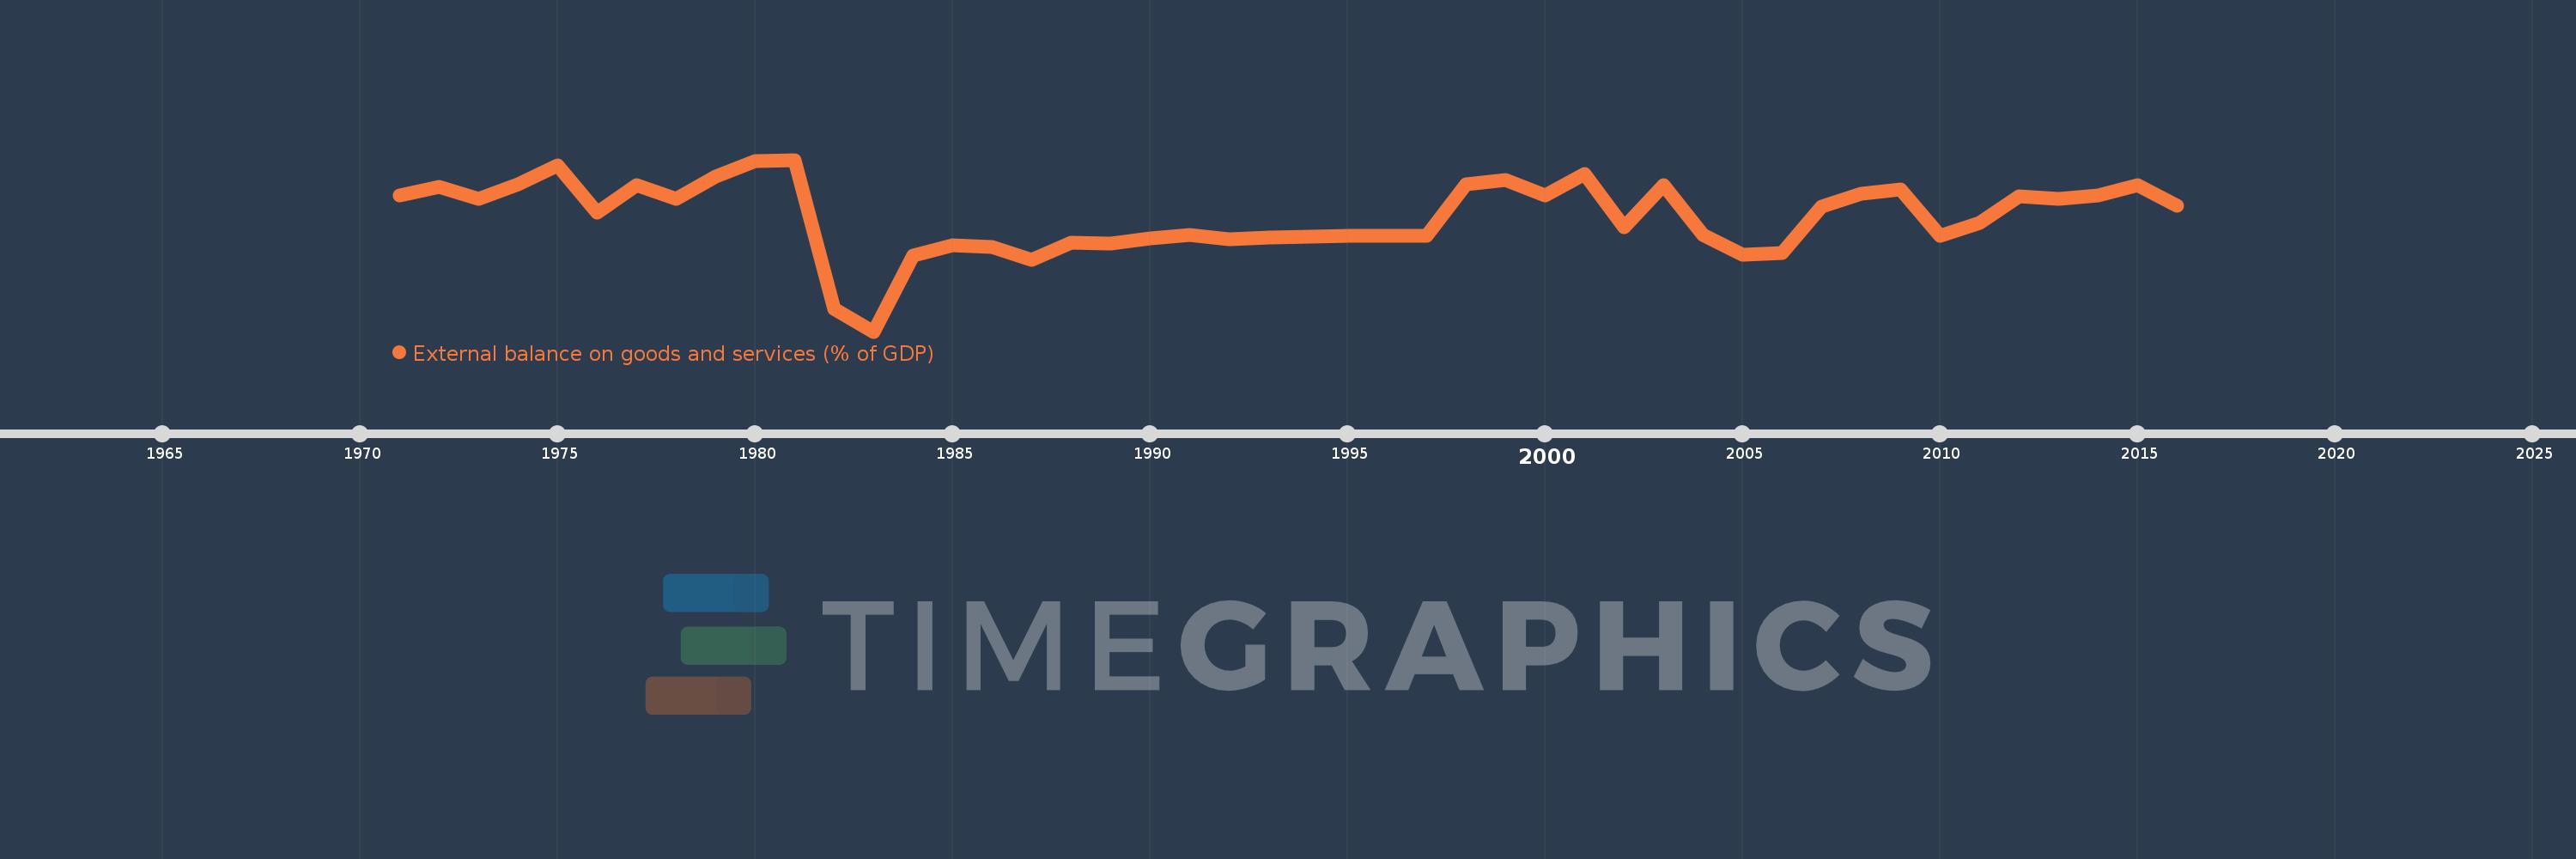
External balance on goods and services (% of GDP)
2016,2015,2014,2013,2012,2011,2010,2009,2008,2007,2006,2005,2004,2003,2002,2001,2000,1999,1998,1997,1996,1995,1994,1993,1992,1991,1990,1989,1988,1987,1986,1985,1984,1983,1982,1981,1980,1979,1978,1977,1976,1975,1974,1973,1972,1971
This statistics in other country:
AfghanistanAlbaniaAlgeriaAngolaAntigua and BarbudaArab WorldArgentinaArmeniaArubaAustraliaAustriaAzerbaijanBahamas, TheBahrainBangladeshBarbadosBelarusBelgiumBelizeBeninBermudaBhutanBoliviaBosnia and HerzegovinaBotswanaBrazilBrunei DarussalamBulgariaBurkina FasoBurundiCabo VerdeCambodiaCameroonCanadaCaribbean small statesCentral African RepublicCentral Europe and the BalticsChadChileChinaColombiaComorosCongo, Dem. Rep.Congo, Rep.Costa RicaCote d'IvoireCroatiaCubaCyprusCzech RepublicDenmarkDjiboutiDominicaDominican RepublicEarly-demographic dividendEast Asia & PacificEast Asia & Pacific (excluding high income)East Asia & Pacific (IDA & IBRD countries)EcuadorEgypt, Arab Rep.El SalvadorEquatorial GuineaEritreaEstoniaEthiopiaEuro areaEurope & Central AsiaEurope & Central Asia (excluding high income)Europe & Central Asia (IDA & IBRD countries)European UnionFaroe IslandsFijiFinlandFragile and conflict affected situationsFranceFrench PolynesiaGabonGambia, TheGeorgiaGermanyGhanaGreeceGrenadaGuatemalaGuineaGuinea-BissauGuyanaHaitiHeavily indebted poor countries (HIPC)High incomeHondurasHong Kong SAR, ChinaHungaryIBRD onlyIcelandIDA & IBRD totalIDA blendIDA onlyIDA totalIndiaIndonesiaIran, Islamic Rep.IraqIrelandIsraelItalyJamaicaJapanJordanKazakhstanKenyaKiribatiKorea, Rep.KosovoKuwaitKyrgyz RepublicLao PDRLate-demographic dividendLatin America & Caribbean Latin America & Caribbean (excluding high income)Latin America & the Caribbean (IDA & IBRD countries)LatviaLeast developed countries: UN classificationLebanonLesothoLiberiaLibyaLithuaniaLow & middle incomeLow incomeLower middle incomeLuxembourgMacao SAR, ChinaMacedonia, FYRMadagascarMalawiMalaysiaMaldivesMaliMaltaMauritaniaMauritiusMexicoMicronesia, Fed. Sts.Middle East & North AfricaMiddle East & North Africa (excluding high income)Middle East & North Africa (IDA & IBRD countries)Middle incomeMoldovaMongoliaMontenegroMoroccoMozambiqueMyanmarNamibiaNepalNetherlandsNew CaledoniaNew ZealandNicaraguaNigerNigeriaNorth AmericaNorwayOECD membersOmanOther small statesPacific island small statesPakistanPalauPanamaPapua New GuineaParaguayPeruPhilippinesPolandPortugalPost-demographic dividendPre-demographic dividendPuerto RicoQatarRomaniaRussian FederationRwandaSamoaSaudi ArabiaSenegalSerbiaSeychellesSierra LeoneSingaporeSlovak RepublicSloveniaSmall statesSolomon IslandsSomaliaSouth AfricaSouth AsiaSouth Asia (IDA & IBRD)South SudanSpainSri LankaSt. Kitts and NevisSt. LuciaSt. Vincent and the GrenadinesSub-Saharan Africa Sub-Saharan Africa (excluding high income)Sub-Saharan Africa (IDA & IBRD countries)SudanSurinameSwazilandSwedenSwitzerlandSyrian Arab RepublicTajikistanTanzaniaThailandTimor-LesteTogoTongaTrinidad and TobagoTunisiaTurkeyTurkmenistanUgandaUkraineUnited Arab EmiratesUnited KingdomUnited StatesUpper middle incomeUruguayUzbekistanVanuatuVenezuela, RBVietnamWest Bank and GazaWorldYemen, Rep.ZambiaZimbabwe Timeline:
This timeline shows a graph from 1971 to 2016 of Iraq. No data until 1970. Number of actual observations by date: 46.
Source name:
World Development Indicators
Source organization:
World Bank national accounts data, and OECD National Accounts data files.
Categories, topics:
Economy & Growth, Trade
Last updated:
apr 23, 2017
Indicators value changes by year
Minimum:
-40.087
jan 1, 1983
Maximum:
31.925
jan 1, 1981
At the date of observation
Value
Absolute change
Change from previous value
jan 1, 1971
17.143
+17.143
0.0%
jan 1, 1972
20.66
+3.517
20.52%
jan 1, 1973
15.444
-5.217
-25.25%
jan 1, 1974
21.721
+6.277
40.65%
jan 1, 1975
29.466
+7.745
35.66%
jan 1, 1976
9.755
-19.711
-66.89%
jan 1, 1977
21.457
+11.702
119.96%
jan 1, 1978
15.365
-6.092
-28.39%
jan 1, 1979
25.029
+9.664
62.9%
jan 1, 1980
31.29
+6.261
25.01%
jan 1, 1981
31.925
+0.635
2.03%
jan 1, 1982
-30.674
-62.599
-196.08%
jan 1, 1983
-40.087
-9.413
30.69%
jan 1, 1984
-8.311
+31.776
-79.27%
jan 1, 1985
-4.0
+4.31
-51.86%
jan 1, 1986
-4.672
-0.671
16.78%
jan 1, 1987
-9.936
-5.264
112.68%
jan 1, 1988
-2.905
+7.031
-70.76%
jan 1, 1989
-3.125
-0.22
7.56%
jan 1, 1990
-0.905
+2.22
-71.04%
jan 1, 1991
0.27
+1.175
-129.87%
jan 1, 1992
-1.21
-1.481
-547.68%
jan 1, 1993
-0.756
+0.454
-37.51%
jan 1, 1994
-0.394
+0.363
-47.96%
jan 1, 1995
-0.028
+0.365
-92.77%
jan 1, 1996
-0.01
+0.018
-63.99%
jan 1, 1997
-0.009
+0.002
-16.4%
jan 1, 1998
21.506
+21.514
-251.19K%
jan 1, 1999
23.555
+2.049
9.53%
jan 1, 2000
16.955
-6.6
-28.02%
jan 1, 2001
26.071
+9.116
53.76%
jan 1, 2002
3.767
-22.304
-85.55%
jan 1, 2003
21.378
+17.612
467.58%
jan 1, 2004
0.551
-20.827
-97.42%
jan 1, 2005
-7.692
-8.243
-1.5K%
jan 1, 2006
-7.047
+0.645
-8.39%
jan 1, 2007
12.413
+19.46
-276.16%
jan 1, 2008
17.707
+5.293
42.64%
jan 1, 2009
19.601
+1.894
10.7%
jan 1, 2010
0.113
-19.488
-99.42%
jan 1, 2011
5.336
+5.223
4.63K%
jan 1, 2012
16.664
+11.328
212.28%
jan 1, 2013
15.408
-1.256
-7.53%
jan 1, 2014
16.977
+1.569
10.18%
jan 1, 2015
21.474
+4.497
26.49%
jan 1, 2016
12.669
-8.805
-41.0%
Ranking of countries by current statistics by years


Comments: