29
/
en
AIzaSyAYiBZKx7MnpbEhh9jyipgxe19OcubqV5w
April 1, 2024
157225
Iran, Islamic Rep.
IRN
true
2
1
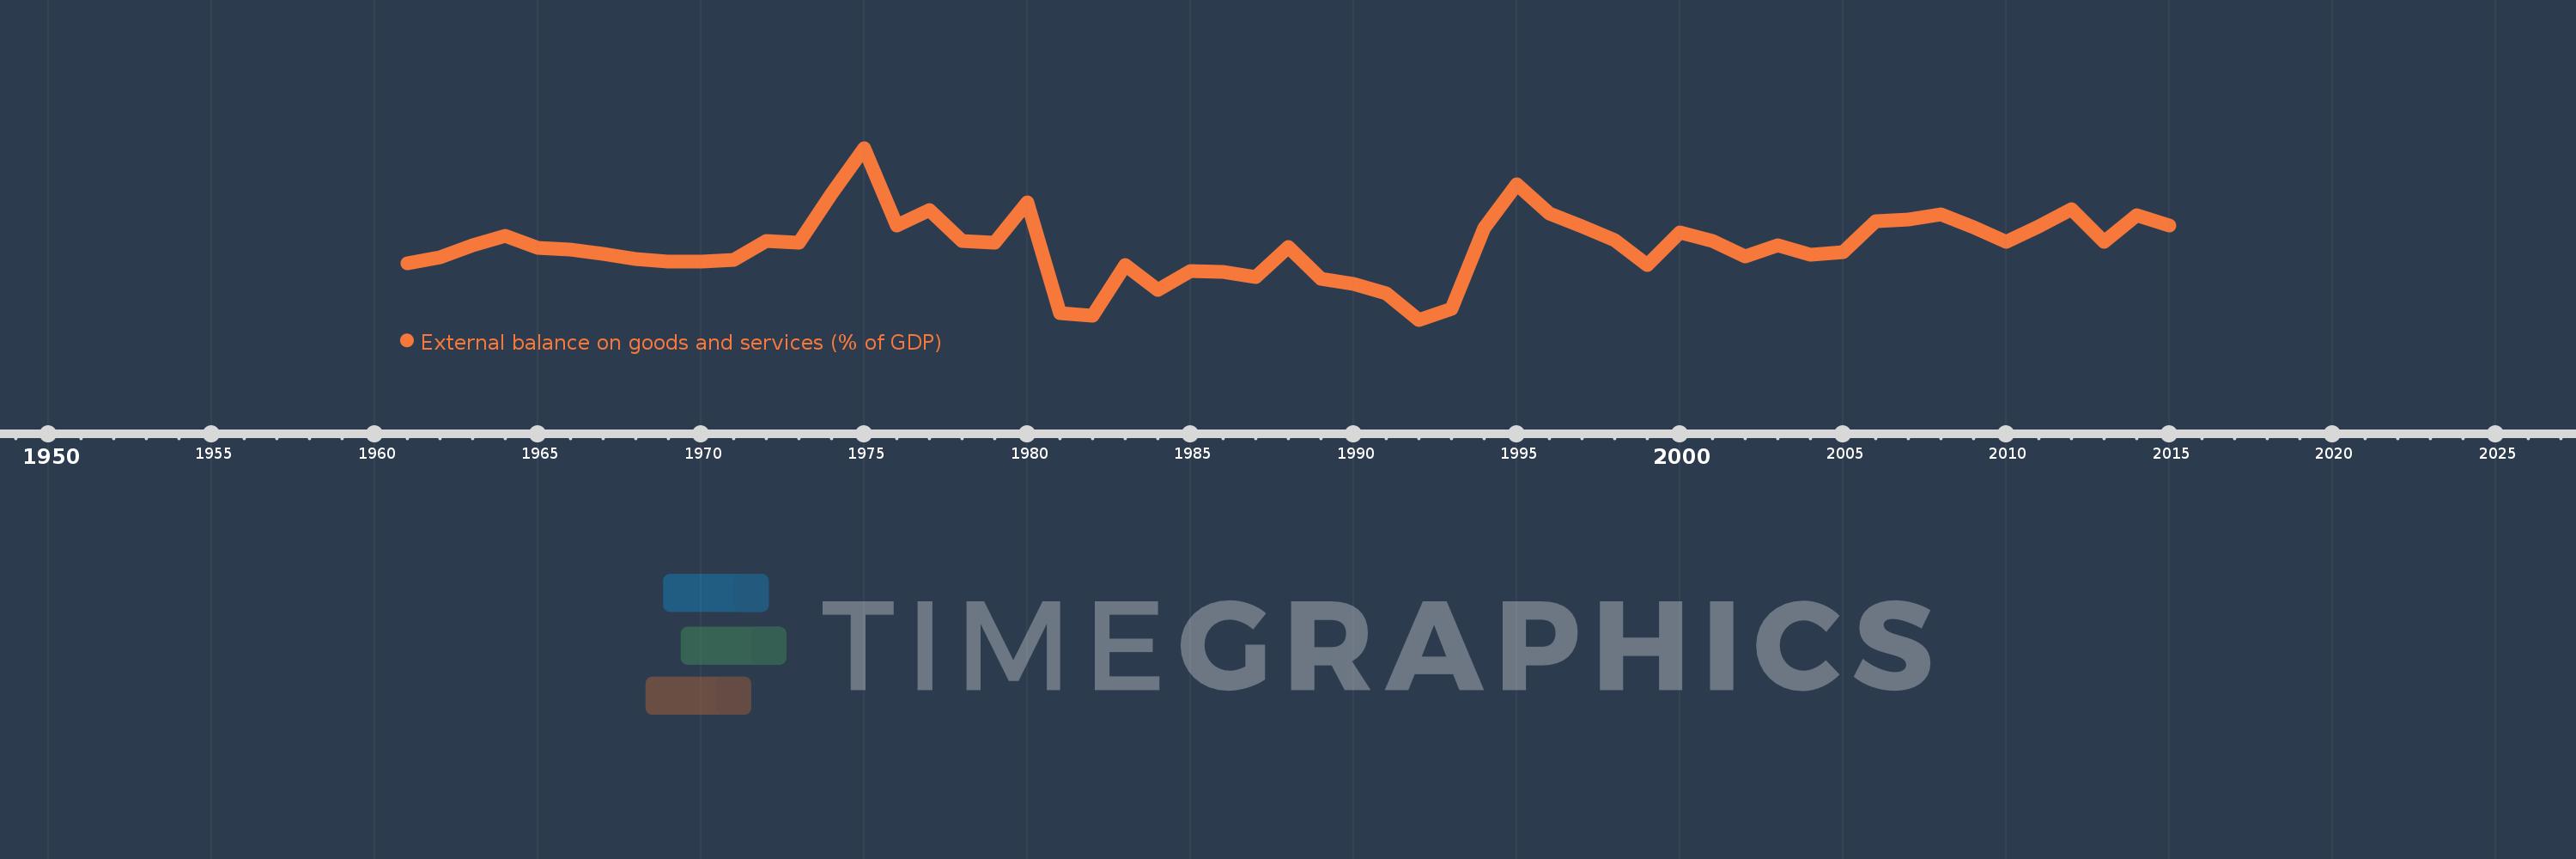
External balance on goods and services (% of GDP)
2015,2014,2013,2012,2011,2010,2009,2008,2007,2006,2005,2004,2003,2002,2001,2000,1999,1998,1997,1996,1995,1994,1993,1992,1991,1990,1989,1988,1987,1986,1985,1984,1983,1982,1981,1980,1979,1978,1977,1976,1975,1974,1973,1972,1971,1970,1969,1968,1967,1966,1965,1964,1963,1962,1961
This statistics in other country:
AfghanistanAlbaniaAlgeriaAngolaAntigua and BarbudaArab WorldArgentinaArmeniaArubaAustraliaAustriaAzerbaijanBahamas, TheBahrainBangladeshBarbadosBelarusBelgiumBelizeBeninBermudaBhutanBoliviaBosnia and HerzegovinaBotswanaBrazilBrunei DarussalamBulgariaBurkina FasoBurundiCabo VerdeCambodiaCameroonCanadaCaribbean small statesCentral African RepublicCentral Europe and the BalticsChadChileChinaColombiaComorosCongo, Dem. Rep.Congo, Rep.Costa RicaCote d'IvoireCroatiaCubaCyprusCzech RepublicDenmarkDjiboutiDominicaDominican RepublicEarly-demographic dividendEast Asia & PacificEast Asia & Pacific (excluding high income)East Asia & Pacific (IDA & IBRD countries)EcuadorEgypt, Arab Rep.El SalvadorEquatorial GuineaEritreaEstoniaEthiopiaEuro areaEurope & Central AsiaEurope & Central Asia (excluding high income)Europe & Central Asia (IDA & IBRD countries)European UnionFaroe IslandsFijiFinlandFragile and conflict affected situationsFranceFrench PolynesiaGabonGambia, TheGeorgiaGermanyGhanaGreeceGrenadaGuatemalaGuineaGuinea-BissauGuyanaHaitiHeavily indebted poor countries (HIPC)High incomeHondurasHong Kong SAR, ChinaHungaryIBRD onlyIcelandIDA & IBRD totalIDA blendIDA onlyIDA totalIndiaIndonesiaIran, Islamic Rep.IraqIrelandIsraelItalyJamaicaJapanJordanKazakhstanKenyaKiribatiKorea, Rep.KosovoKuwaitKyrgyz RepublicLao PDRLate-demographic dividendLatin America & Caribbean Latin America & Caribbean (excluding high income)Latin America & the Caribbean (IDA & IBRD countries)LatviaLeast developed countries: UN classificationLebanonLesothoLiberiaLibyaLithuaniaLow & middle incomeLow incomeLower middle incomeLuxembourgMacao SAR, ChinaMacedonia, FYRMadagascarMalawiMalaysiaMaldivesMaliMaltaMauritaniaMauritiusMexicoMicronesia, Fed. Sts.Middle East & North AfricaMiddle East & North Africa (excluding high income)Middle East & North Africa (IDA & IBRD countries)Middle incomeMoldovaMongoliaMontenegroMoroccoMozambiqueMyanmarNamibiaNepalNetherlandsNew CaledoniaNew ZealandNicaraguaNigerNigeriaNorth AmericaNorwayOECD membersOmanOther small statesPacific island small statesPakistanPalauPanamaPapua New GuineaParaguayPeruPhilippinesPolandPortugalPost-demographic dividendPre-demographic dividendPuerto RicoQatarRomaniaRussian FederationRwandaSamoaSaudi ArabiaSenegalSerbiaSeychellesSierra LeoneSingaporeSlovak RepublicSloveniaSmall statesSolomon IslandsSomaliaSouth AfricaSouth AsiaSouth Asia (IDA & IBRD)South SudanSpainSri LankaSt. Kitts and NevisSt. LuciaSt. Vincent and the GrenadinesSub-Saharan Africa Sub-Saharan Africa (excluding high income)Sub-Saharan Africa (IDA & IBRD countries)SudanSurinameSwazilandSwedenSwitzerlandSyrian Arab RepublicTajikistanTanzaniaThailandTimor-LesteTogoTongaTrinidad and TobagoTunisiaTurkeyTurkmenistanUgandaUkraineUnited Arab EmiratesUnited KingdomUnited StatesUpper middle incomeUruguayUzbekistanVanuatuVenezuela, RBVietnamWest Bank and GazaWorldYemen, Rep.ZambiaZimbabwe Timeline:
This timeline shows a graph from 1961 to 2015 of Iran, Islamic Rep.. No data until 1960. Number of actual observations by date: 55.
Source name:
World Development Indicators
Source organization:
World Bank national accounts data, and OECD National Accounts data files.
Categories, topics:
Economy & Growth, Trade
Last updated:
apr 23, 2017
Indicators value changes by year
Minimum:
-16.546
jan 1, 1992
Maximum:
23.337
jan 1, 1975
At the date of observation
Value
Absolute change
Change from previous value
jan 1, 1961
-3.539
-3.539
0.0%
jan 1, 1962
-2.131
+1.408
-39.79%
jan 1, 1963
0.819
+2.95
-138.42%
jan 1, 1964
2.871
+2.052
250.68%
jan 1, 1965
0.068
-2.803
-97.63%
jan 1, 1966
-0.325
-0.393
-579.25%
jan 1, 1967
-1.318
-0.993
304.99%
jan 1, 1968
-2.362
-1.044
79.21%
jan 1, 1969
-3.034
-0.671
28.41%
jan 1, 1970
-3.022
+0.012
-0.38%
jan 1, 1971
-2.736
+0.286
-9.47%
jan 1, 1972
1.782
+4.518
-165.15%
jan 1, 1973
1.441
-0.341
-19.13%
jan 1, 1974
12.782
+11.341
786.75%
jan 1, 1975
23.337
+10.555
82.57%
jan 1, 1976
5.356
-17.981
-77.05%
jan 1, 1977
8.975
+3.619
67.57%
jan 1, 1978
1.703
-7.272
-81.03%
jan 1, 1979
1.255
-0.448
-26.31%
jan 1, 1980
10.687
+9.432
751.87%
jan 1, 1981
-15.011
-25.697
-240.46%
jan 1, 1982
-15.574
-0.563
3.75%
jan 1, 1983
-3.883
+11.691
-75.07%
jan 1, 1984
-9.662
-5.779
148.84%
jan 1, 1985
-5.307
+4.355
-45.07%
jan 1, 1986
-5.405
-0.098
1.85%
jan 1, 1987
-6.682
-1.276
23.61%
jan 1, 1988
0.43
+7.112
-106.43%
jan 1, 1989
-7.014
-7.444
-1.73K%
jan 1, 1990
-8.28
-1.267
18.06%
jan 1, 1991
-10.523
-2.243
27.08%
jan 1, 1992
-16.546
-6.022
57.23%
jan 1, 1993
-14.069
+2.477
-14.97%
jan 1, 1994
4.779
+18.848
-133.97%
jan 1, 1995
14.963
+10.184
213.08%
jan 1, 1996
8.208
-6.755
-45.14%
jan 1, 1997
5.169
-3.039
-37.03%
jan 1, 1998
1.906
-3.263
-63.12%
jan 1, 1999
-3.861
-5.768
-302.56%
jan 1, 2000
3.699
+7.56
-195.78%
jan 1, 2001
1.677
-2.022
-54.66%
jan 1, 2002
-1.929
-3.606
-215.03%
jan 1, 2003
0.655
+2.584
-133.96%
jan 1, 2004
-1.424
-2.079
-317.39%
jan 1, 2005
-0.807
+0.617
-43.34%
jan 1, 2006
6.386
+7.193
-891.33%
jan 1, 2007
6.712
+0.326
5.11%
jan 1, 2008
7.882
+1.17
17.44%
jan 1, 2009
4.944
-2.938
-37.27%
jan 1, 2010
1.613
-3.331
-67.38%
jan 1, 2011
5.063
+3.45
213.95%
jan 1, 2012
9.119
+4.056
80.11%
jan 1, 2013
1.629
-7.49
-82.14%
jan 1, 2014
7.685
+6.056
371.81%
jan 1, 2015
5.275
-2.411
-31.37%
Ranking of countries by current statistics by years


Comments: