29
/
en
AIzaSyAYiBZKx7MnpbEhh9jyipgxe19OcubqV5w
April 1, 2024
104815
Chile
CHL
true
2
1
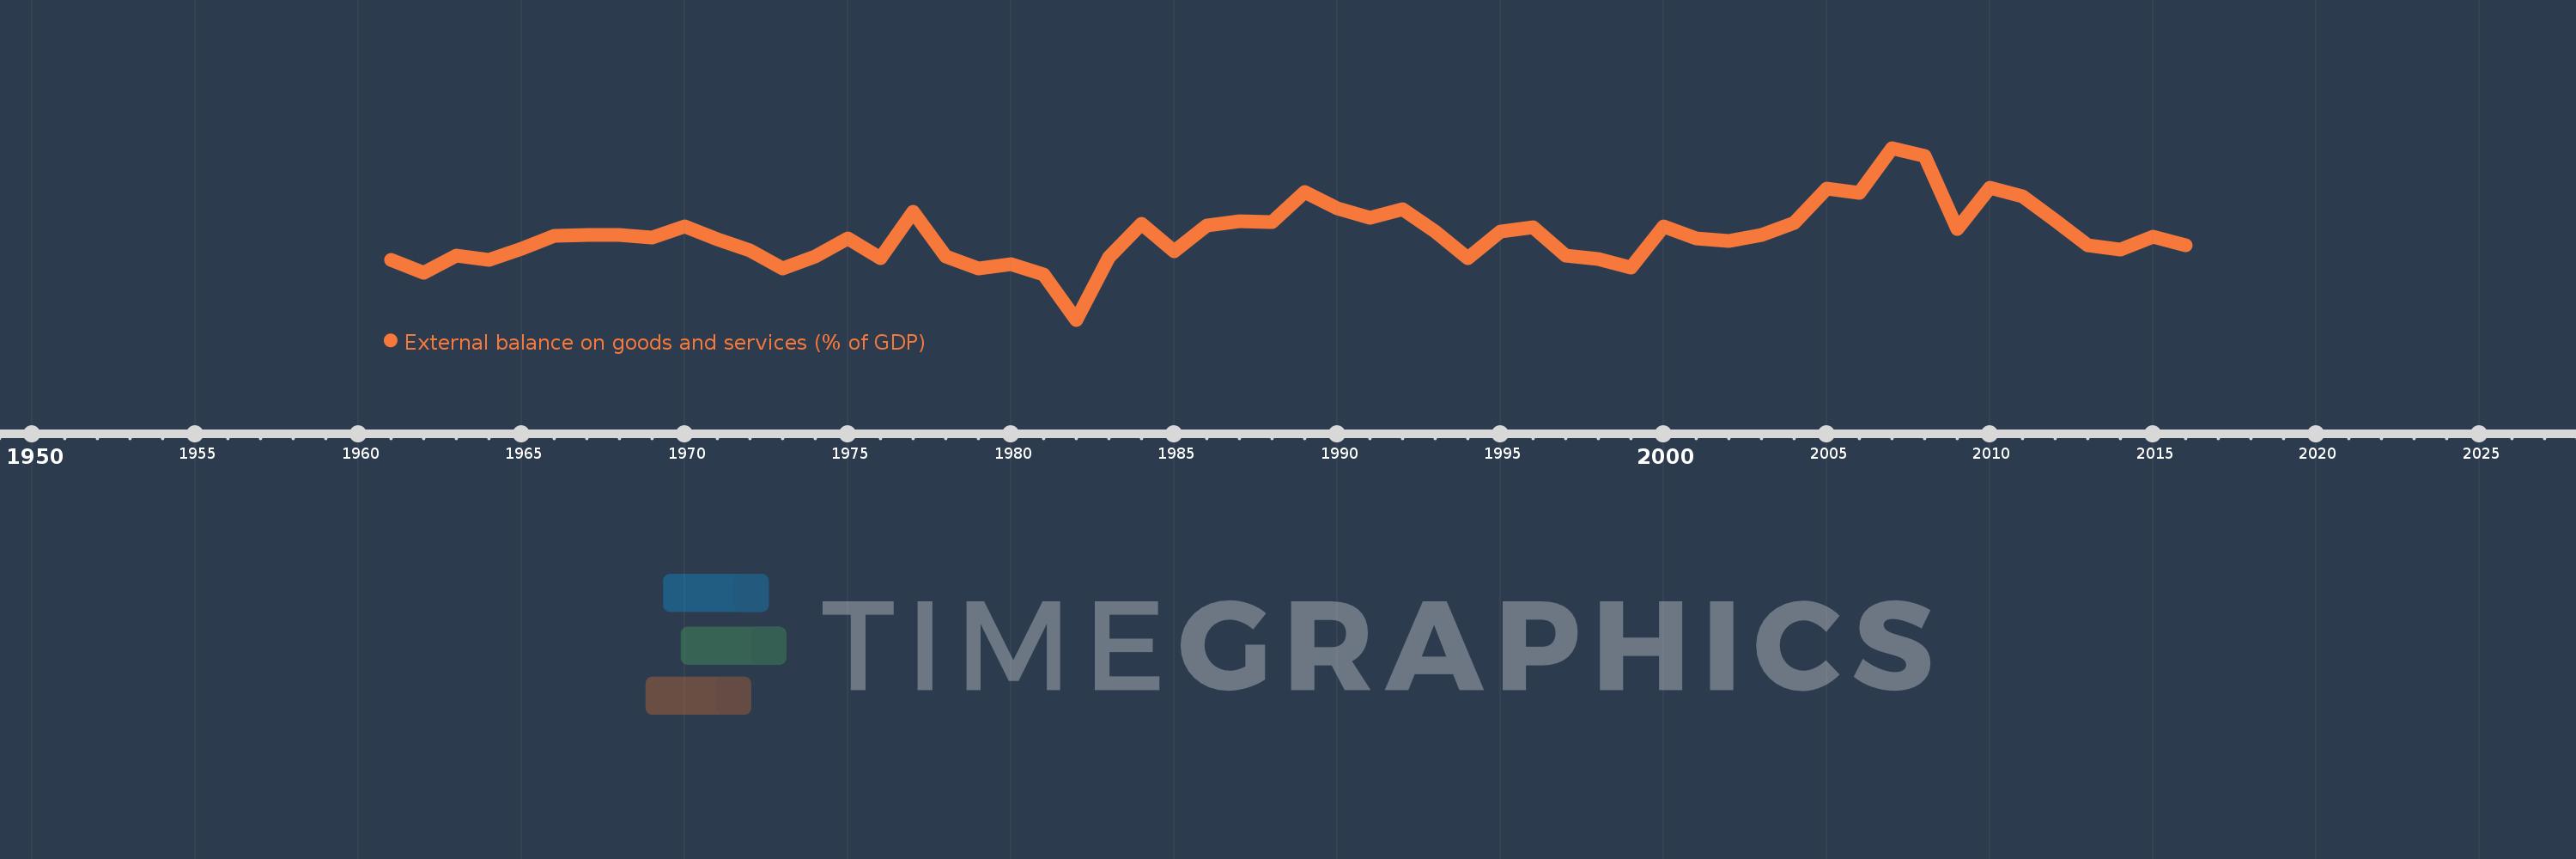
External balance on goods and services (% of GDP)
2016,2015,2014,2013,2012,2011,2010,2009,2008,2007,2006,2005,2004,2003,2002,2001,2000,1999,1998,1997,1996,1995,1994,1993,1992,1991,1990,1989,1988,1987,1986,1985,1984,1983,1982,1981,1980,1979,1978,1977,1976,1975,1974,1973,1972,1971,1970,1969,1968,1967,1966,1965,1964,1963,1962,1961
This statistics in other country:
AfghanistanAlbaniaAlgeriaAngolaAntigua and BarbudaArab WorldArgentinaArmeniaArubaAustraliaAustriaAzerbaijanBahamas, TheBahrainBangladeshBarbadosBelarusBelgiumBelizeBeninBermudaBhutanBoliviaBosnia and HerzegovinaBotswanaBrazilBrunei DarussalamBulgariaBurkina FasoBurundiCabo VerdeCambodiaCameroonCanadaCaribbean small statesCentral African RepublicCentral Europe and the BalticsChadChileChinaColombiaComorosCongo, Dem. Rep.Congo, Rep.Costa RicaCote d'IvoireCroatiaCubaCyprusCzech RepublicDenmarkDjiboutiDominicaDominican RepublicEarly-demographic dividendEast Asia & PacificEast Asia & Pacific (excluding high income)East Asia & Pacific (IDA & IBRD countries)EcuadorEgypt, Arab Rep.El SalvadorEquatorial GuineaEritreaEstoniaEthiopiaEuro areaEurope & Central AsiaEurope & Central Asia (excluding high income)Europe & Central Asia (IDA & IBRD countries)European UnionFaroe IslandsFijiFinlandFragile and conflict affected situationsFranceFrench PolynesiaGabonGambia, TheGeorgiaGermanyGhanaGreeceGrenadaGuatemalaGuineaGuinea-BissauGuyanaHaitiHeavily indebted poor countries (HIPC)High incomeHondurasHong Kong SAR, ChinaHungaryIBRD onlyIcelandIDA & IBRD totalIDA blendIDA onlyIDA totalIndiaIndonesiaIran, Islamic Rep.IraqIrelandIsraelItalyJamaicaJapanJordanKazakhstanKenyaKiribatiKorea, Rep.KosovoKuwaitKyrgyz RepublicLao PDRLate-demographic dividendLatin America & Caribbean Latin America & Caribbean (excluding high income)Latin America & the Caribbean (IDA & IBRD countries)LatviaLeast developed countries: UN classificationLebanonLesothoLiberiaLibyaLithuaniaLow & middle incomeLow incomeLower middle incomeLuxembourgMacao SAR, ChinaMacedonia, FYRMadagascarMalawiMalaysiaMaldivesMaliMaltaMauritaniaMauritiusMexicoMicronesia, Fed. Sts.Middle East & North AfricaMiddle East & North Africa (excluding high income)Middle East & North Africa (IDA & IBRD countries)Middle incomeMoldovaMongoliaMontenegroMoroccoMozambiqueMyanmarNamibiaNepalNetherlandsNew CaledoniaNew ZealandNicaraguaNigerNigeriaNorth AmericaNorwayOECD membersOmanOther small statesPacific island small statesPakistanPalauPanamaPapua New GuineaParaguayPeruPhilippinesPolandPortugalPost-demographic dividendPre-demographic dividendPuerto RicoQatarRomaniaRussian FederationRwandaSamoaSaudi ArabiaSenegalSerbiaSeychellesSierra LeoneSingaporeSlovak RepublicSloveniaSmall statesSolomon IslandsSomaliaSouth AfricaSouth AsiaSouth Asia (IDA & IBRD)South SudanSpainSri LankaSt. Kitts and NevisSt. LuciaSt. Vincent and the GrenadinesSub-Saharan Africa Sub-Saharan Africa (excluding high income)Sub-Saharan Africa (IDA & IBRD countries)SudanSurinameSwazilandSwedenSwitzerlandSyrian Arab RepublicTajikistanTanzaniaThailandTimor-LesteTogoTongaTrinidad and TobagoTunisiaTurkeyTurkmenistanUgandaUkraineUnited Arab EmiratesUnited KingdomUnited StatesUpper middle incomeUruguayUzbekistanVanuatuVenezuela, RBVietnamWest Bank and GazaWorldYemen, Rep.ZambiaZimbabwe Timeline:
This timeline shows a graph from 1961 to 2016 of Chile. No data until 1960. Number of actual observations by date: 56.
Source name:
World Development Indicators
Source organization:
World Bank national accounts data, and OECD National Accounts data files.
Categories, topics:
Economy & Growth, Trade
Last updated:
apr 23, 2017
Indicators value changes by year
Minimum:
-10.336
jan 1, 1982
Maximum:
12.923
jan 1, 2007
At the date of observation
Value
Absolute change
Change from previous value
jan 1, 1961
-2.244
-2.244
0.0%
jan 1, 1962
-4.014
-1.77
78.85%
jan 1, 1963
-1.703
+2.311
-57.57%
jan 1, 1964
-2.23
-0.527
30.93%
jan 1, 1965
-0.742
+1.488
-66.74%
jan 1, 1966
1.047
+1.788
-241.09%
jan 1, 1967
1.111
+0.064
6.13%
jan 1, 1968
1.142
+0.031
2.78%
jan 1, 1969
0.822
-0.319
-27.98%
jan 1, 1970
2.27
+1.448
176.07%
jan 1, 1971
0.592
-1.677
-73.9%
jan 1, 1972
-0.996
-1.588
-268.06%
jan 1, 1973
-3.413
-2.417
242.76%
jan 1, 1974
-1.814
+1.598
-46.84%
jan 1, 1975
0.676
+2.491
-137.28%
jan 1, 1976
-1.973
-2.649
-391.65%
jan 1, 1977
4.329
+6.302
-319.44%
jan 1, 1978
-1.802
-6.131
-141.62%
jan 1, 1979
-3.343
-1.541
85.54%
jan 1, 1980
-2.831
+0.512
-15.32%
jan 1, 1981
-4.158
-1.327
46.88%
jan 1, 1982
-10.336
-6.178
148.58%
jan 1, 1983
-1.885
+8.451
-81.76%
jan 1, 1984
2.692
+4.577
-242.81%
jan 1, 1985
-1.109
-3.801
-141.19%
jan 1, 1986
2.435
+3.543
-319.58%
jan 1, 1987
3.059
+0.625
25.65%
jan 1, 1988
2.907
-0.152
-4.98%
jan 1, 1989
6.995
+4.088
140.64%
jan 1, 1990
4.738
-2.257
-32.27%
jan 1, 1991
3.436
-1.301
-27.47%
jan 1, 1992
4.626
+1.19
34.62%
jan 1, 1993
1.643
-2.983
-64.49%
jan 1, 1994
-1.996
-3.639
-221.48%
jan 1, 1995
1.664
+3.659
-183.36%
jan 1, 1996
2.2
+0.536
32.25%
jan 1, 1997
-1.688
-3.889
-176.74%
jan 1, 1998
-2.119
-0.431
25.52%
jan 1, 1999
-3.266
-1.147
54.11%
jan 1, 2000
2.272
+5.538
-169.57%
jan 1, 2001
0.709
-1.563
-68.79%
jan 1, 2002
0.33
-0.379
-53.51%
jan 1, 2003
1.15
+0.82
248.68%
jan 1, 2004
2.722
+1.573
136.8%
jan 1, 2005
7.451
+4.729
173.74%
jan 1, 2006
6.797
-0.654
-8.78%
jan 1, 2007
12.923
+6.126
90.12%
jan 1, 2008
11.866
-1.057
-8.18%
jan 1, 2009
1.972
-9.894
-83.38%
jan 1, 2010
7.573
+5.601
284.05%
jan 1, 2011
6.39
-1.183
-15.62%
jan 1, 2012
3.154
-3.236
-50.64%
jan 1, 2013
-0.198
-3.352
-106.29%
jan 1, 2014
-0.779
-0.581
292.64%
jan 1, 2015
0.89
+1.669
-214.28%
jan 1, 2016
-0.273
-1.163
-130.69%
Ranking of countries by current statistics by years


Comments: