29
/
en
AIzaSyAYiBZKx7MnpbEhh9jyipgxe19OcubqV5w
April 1, 2024
98524
Cambodia
KHM
true
2
1
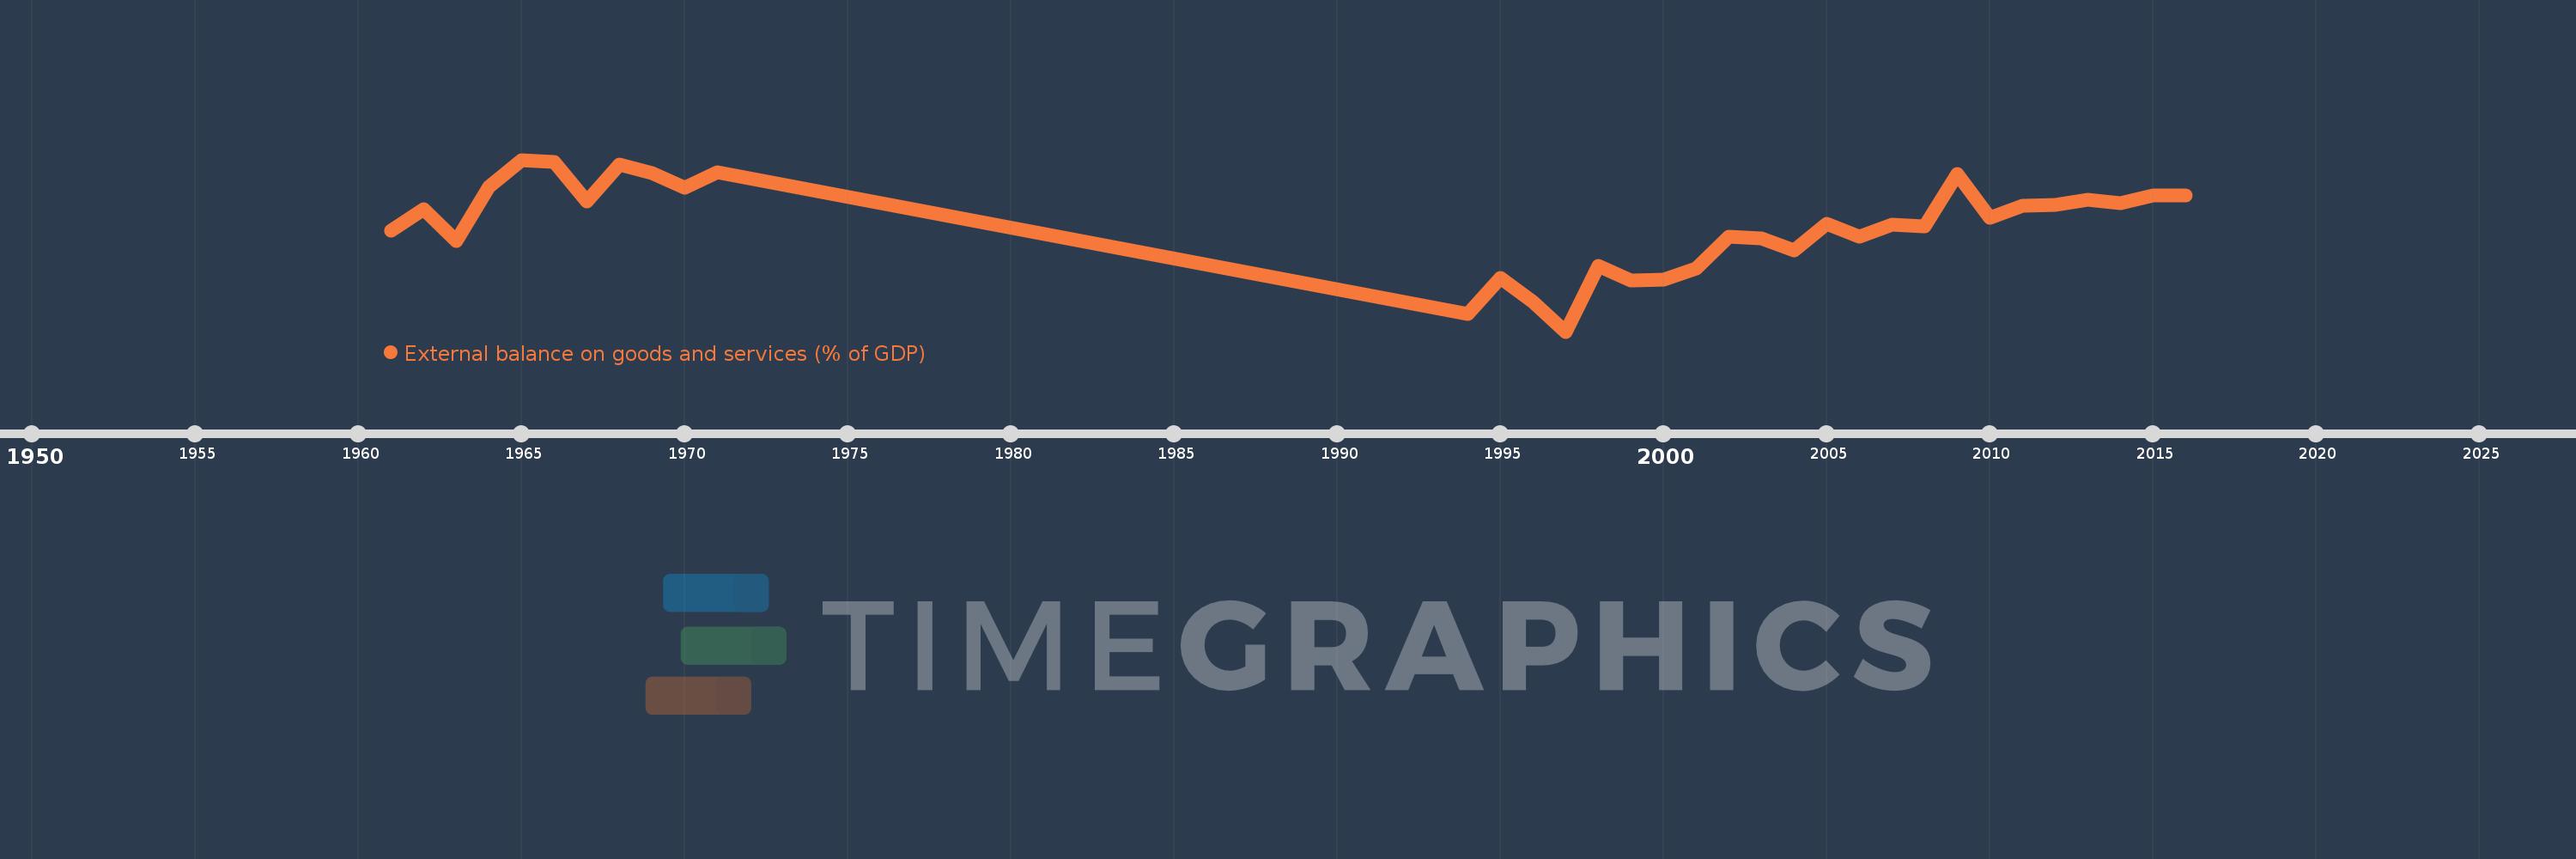
External balance on goods and services (% of GDP)
2016,2015,2014,2013,2012,2011,2010,2009,2008,2007,2006,2005,2004,2003,2002,2001,2000,1999,1998,1997,1996,1995,1994,1971,1970,1969,1968,1967,1966,1965,1964,1963,1962,1961
This statistics in other country:
AfghanistanAlbaniaAlgeriaAngolaAntigua and BarbudaArab WorldArgentinaArmeniaArubaAustraliaAustriaAzerbaijanBahamas, TheBahrainBangladeshBarbadosBelarusBelgiumBelizeBeninBermudaBhutanBoliviaBosnia and HerzegovinaBotswanaBrazilBrunei DarussalamBulgariaBurkina FasoBurundiCabo VerdeCambodiaCameroonCanadaCaribbean small statesCentral African RepublicCentral Europe and the BalticsChadChileChinaColombiaComorosCongo, Dem. Rep.Congo, Rep.Costa RicaCote d'IvoireCroatiaCubaCyprusCzech RepublicDenmarkDjiboutiDominicaDominican RepublicEarly-demographic dividendEast Asia & PacificEast Asia & Pacific (excluding high income)East Asia & Pacific (IDA & IBRD countries)EcuadorEgypt, Arab Rep.El SalvadorEquatorial GuineaEritreaEstoniaEthiopiaEuro areaEurope & Central AsiaEurope & Central Asia (excluding high income)Europe & Central Asia (IDA & IBRD countries)European UnionFaroe IslandsFijiFinlandFragile and conflict affected situationsFranceFrench PolynesiaGabonGambia, TheGeorgiaGermanyGhanaGreeceGrenadaGuatemalaGuineaGuinea-BissauGuyanaHaitiHeavily indebted poor countries (HIPC)High incomeHondurasHong Kong SAR, ChinaHungaryIBRD onlyIcelandIDA & IBRD totalIDA blendIDA onlyIDA totalIndiaIndonesiaIran, Islamic Rep.IraqIrelandIsraelItalyJamaicaJapanJordanKazakhstanKenyaKiribatiKorea, Rep.KosovoKuwaitKyrgyz RepublicLao PDRLate-demographic dividendLatin America & Caribbean Latin America & Caribbean (excluding high income)Latin America & the Caribbean (IDA & IBRD countries)LatviaLeast developed countries: UN classificationLebanonLesothoLiberiaLibyaLithuaniaLow & middle incomeLow incomeLower middle incomeLuxembourgMacao SAR, ChinaMacedonia, FYRMadagascarMalawiMalaysiaMaldivesMaliMaltaMauritaniaMauritiusMexicoMicronesia, Fed. Sts.Middle East & North AfricaMiddle East & North Africa (excluding high income)Middle East & North Africa (IDA & IBRD countries)Middle incomeMoldovaMongoliaMontenegroMoroccoMozambiqueMyanmarNamibiaNepalNetherlandsNew CaledoniaNew ZealandNicaraguaNigerNigeriaNorth AmericaNorwayOECD membersOmanOther small statesPacific island small statesPakistanPalauPanamaPapua New GuineaParaguayPeruPhilippinesPolandPortugalPost-demographic dividendPre-demographic dividendPuerto RicoQatarRomaniaRussian FederationRwandaSamoaSaudi ArabiaSenegalSerbiaSeychellesSierra LeoneSingaporeSlovak RepublicSloveniaSmall statesSolomon IslandsSomaliaSouth AfricaSouth AsiaSouth Asia (IDA & IBRD)South SudanSpainSri LankaSt. Kitts and NevisSt. LuciaSt. Vincent and the GrenadinesSub-Saharan Africa Sub-Saharan Africa (excluding high income)Sub-Saharan Africa (IDA & IBRD countries)SudanSurinameSwazilandSwedenSwitzerlandSyrian Arab RepublicTajikistanTanzaniaThailandTimor-LesteTogoTongaTrinidad and TobagoTunisiaTurkeyTurkmenistanUgandaUkraineUnited Arab EmiratesUnited KingdomUnited StatesUpper middle incomeUruguayUzbekistanVanuatuVenezuela, RBVietnamWest Bank and GazaWorldYemen, Rep.ZambiaZimbabwe Timeline:
This timeline shows a graph from 1961 to 2016 of Cambodia. No data until 1960. Number of actual observations by date: 34.
Source name:
World Development Indicators
Source organization:
World Bank national accounts data, and OECD National Accounts data files.
Categories, topics:
Economy & Growth, Trade
Last updated:
apr 23, 2017
Indicators value changes by year
Minimum:
-18.434
jan 1, 1997
At the date of observation
Value
Absolute change
Change from previous value
jan 1, 1961
-8.072
-8.072
0.0%
jan 1, 1962
-5.778
+2.294
-28.42%
jan 1, 1963
-9.091
-3.313
57.34%
jan 1, 1964
-3.529
+5.561
-61.18%
jan 1, 1965
-0.73
+2.799
-79.32%
jan 1, 1966
-0.987
-0.257
35.2%
jan 1, 1967
-5.0
-4.013
406.67%
jan 1, 1968
-1.187
+3.813
-76.26%
jan 1, 1969
-2.145
-0.958
80.7%
jan 1, 1970
-3.597
-1.452
67.72%
jan 1, 1971
-2.005
+1.592
-44.26%
jan 1, 1994
-16.61
-14.605
728.43%
jan 1, 1995
-12.884
+3.726
-22.43%
jan 1, 1996
-15.398
-2.514
19.51%
jan 1, 1997
-18.434
-3.035
19.71%
jan 1, 1998
-11.701
+6.733
-36.52%
jan 1, 1999
-13.143
-1.442
12.33%
jan 1, 2000
-13.089
+0.055
-0.42%
jan 1, 2001
-11.917
+1.171
-8.95%
jan 1, 2002
-8.67
+3.247
-27.25%
jan 1, 2003
-8.849
-0.179
2.06%
jan 1, 2004
-10.04
-1.191
13.46%
jan 1, 2005
-7.3
+2.74
-27.29%
jan 1, 2006
-8.663
-1.363
18.67%
jan 1, 2007
-7.428
+1.235
-14.25%
jan 1, 2008
-7.616
-0.188
2.53%
jan 1, 2009
-2.234
+5.382
-70.67%
jan 1, 2010
-6.697
-4.463
199.81%
jan 1, 2011
-5.438
+1.259
-18.8%
jan 1, 2012
-5.42
+0.018
-0.33%
jan 1, 2013
-4.823
+0.597
-11.01%
jan 1, 2014
-5.195
-0.372
7.7%
jan 1, 2015
-4.386
+0.809
-15.58%
jan 1, 2016
-4.427
-0.042
0.95%
Ranking of countries by current statistics by years


Comments: