29
/
en
AIzaSyAYiBZKx7MnpbEhh9jyipgxe19OcubqV5w
April 1, 2024
116841
Cyprus
CYP
true
2
1
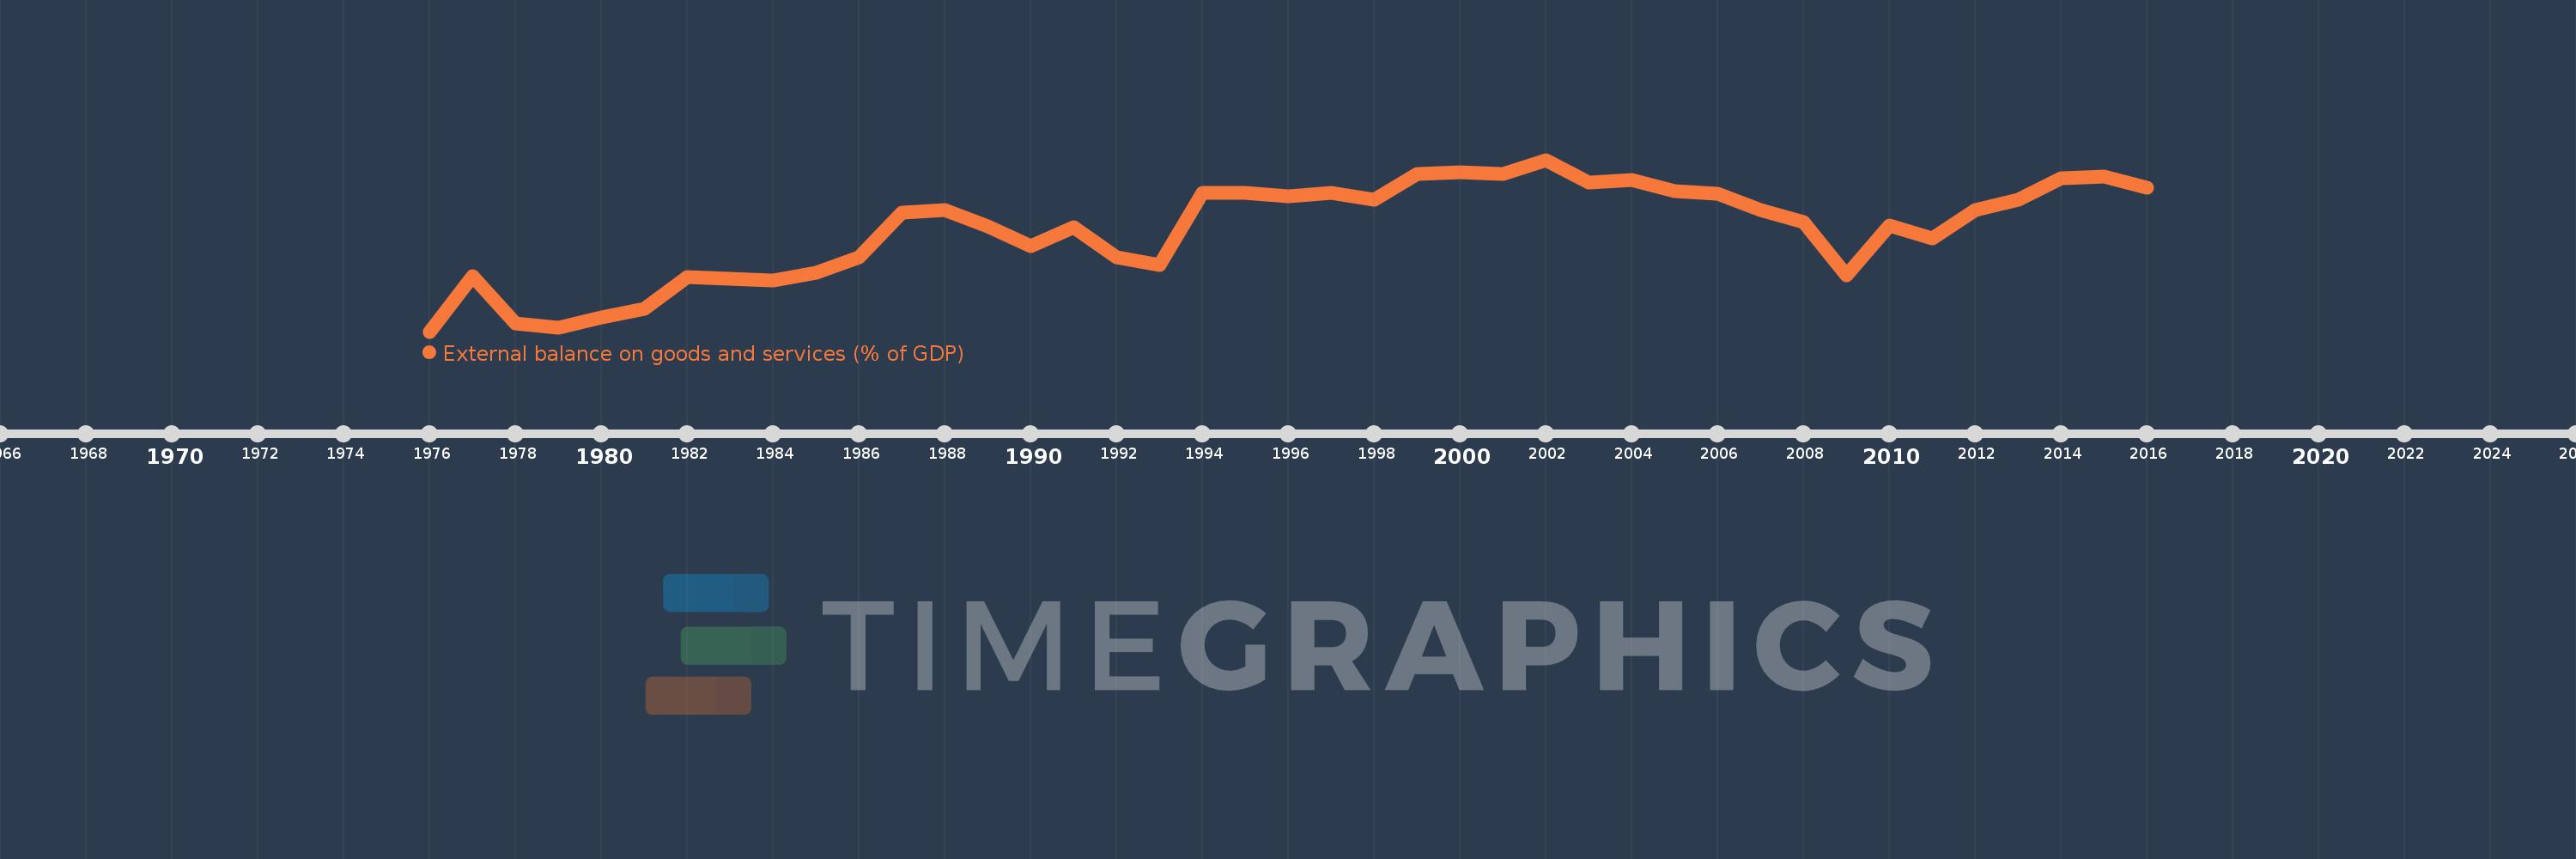
External balance on goods and services (% of GDP)
2016,2015,2014,2013,2012,2011,2010,2009,2008,2007,2006,2005,2004,2003,2002,2001,2000,1999,1998,1997,1996,1995,1994,1993,1992,1991,1990,1989,1988,1987,1986,1985,1984,1983,1982,1981,1980,1979,1978,1977,1976
This statistics in other country:
AfghanistanAlbaniaAlgeriaAngolaAntigua and BarbudaArab WorldArgentinaArmeniaArubaAustraliaAustriaAzerbaijanBahamas, TheBahrainBangladeshBarbadosBelarusBelgiumBelizeBeninBermudaBhutanBoliviaBosnia and HerzegovinaBotswanaBrazilBrunei DarussalamBulgariaBurkina FasoBurundiCabo VerdeCambodiaCameroonCanadaCaribbean small statesCentral African RepublicCentral Europe and the BalticsChadChileChinaColombiaComorosCongo, Dem. Rep.Congo, Rep.Costa RicaCote d'IvoireCroatiaCubaCyprusCzech RepublicDenmarkDjiboutiDominicaDominican RepublicEarly-demographic dividendEast Asia & PacificEast Asia & Pacific (excluding high income)East Asia & Pacific (IDA & IBRD countries)EcuadorEgypt, Arab Rep.El SalvadorEquatorial GuineaEritreaEstoniaEthiopiaEuro areaEurope & Central AsiaEurope & Central Asia (excluding high income)Europe & Central Asia (IDA & IBRD countries)European UnionFaroe IslandsFijiFinlandFragile and conflict affected situationsFranceFrench PolynesiaGabonGambia, TheGeorgiaGermanyGhanaGreeceGrenadaGuatemalaGuineaGuinea-BissauGuyanaHaitiHeavily indebted poor countries (HIPC)High incomeHondurasHong Kong SAR, ChinaHungaryIBRD onlyIcelandIDA & IBRD totalIDA blendIDA onlyIDA totalIndiaIndonesiaIran, Islamic Rep.IraqIrelandIsraelItalyJamaicaJapanJordanKazakhstanKenyaKiribatiKorea, Rep.KosovoKuwaitKyrgyz RepublicLao PDRLate-demographic dividendLatin America & Caribbean Latin America & Caribbean (excluding high income)Latin America & the Caribbean (IDA & IBRD countries)LatviaLeast developed countries: UN classificationLebanonLesothoLiberiaLibyaLithuaniaLow & middle incomeLow incomeLower middle incomeLuxembourgMacao SAR, ChinaMacedonia, FYRMadagascarMalawiMalaysiaMaldivesMaliMaltaMauritaniaMauritiusMexicoMicronesia, Fed. Sts.Middle East & North AfricaMiddle East & North Africa (excluding high income)Middle East & North Africa (IDA & IBRD countries)Middle incomeMoldovaMongoliaMontenegroMoroccoMozambiqueMyanmarNamibiaNepalNetherlandsNew CaledoniaNew ZealandNicaraguaNigerNigeriaNorth AmericaNorwayOECD membersOmanOther small statesPacific island small statesPakistanPalauPanamaPapua New GuineaParaguayPeruPhilippinesPolandPortugalPost-demographic dividendPre-demographic dividendPuerto RicoQatarRomaniaRussian FederationRwandaSamoaSaudi ArabiaSenegalSerbiaSeychellesSierra LeoneSingaporeSlovak RepublicSloveniaSmall statesSolomon IslandsSomaliaSouth AfricaSouth AsiaSouth Asia (IDA & IBRD)South SudanSpainSri LankaSt. Kitts and NevisSt. LuciaSt. Vincent and the GrenadinesSub-Saharan Africa Sub-Saharan Africa (excluding high income)Sub-Saharan Africa (IDA & IBRD countries)SudanSurinameSwazilandSwedenSwitzerlandSyrian Arab RepublicTajikistanTanzaniaThailandTimor-LesteTogoTongaTrinidad and TobagoTunisiaTurkeyTurkmenistanUgandaUkraineUnited Arab EmiratesUnited KingdomUnited StatesUpper middle incomeUruguayUzbekistanVanuatuVenezuela, RBVietnamWest Bank and GazaWorldYemen, Rep.ZambiaZimbabwe Timeline:
This timeline shows a graph from 1976 to 2016 of Cyprus. No data until 1975. Number of actual observations by date: 41.
Source name:
World Development Indicators
Source organization:
World Bank national accounts data, and OECD National Accounts data files.
Categories, topics:
Economy & Growth, Trade
Last updated:
apr 23, 2017
Indicators value changes by year
Minimum:
-21.206
jan 1, 1976
At the date of observation
Value
Absolute change
Change from previous value
jan 1, 1976
-21.206
-21.206
0.0%
jan 1, 1977
-12.878
+8.328
-39.27%
jan 1, 1978
-19.948
-7.07
54.9%
jan 1, 1979
-20.592
-0.644
3.23%
jan 1, 1980
-19.085
+1.507
-7.32%
jan 1, 1981
-17.809
+1.277
-6.69%
jan 1, 1982
-13.071
+4.738
-26.6%
jan 1, 1983
-13.318
-0.248
1.89%
jan 1, 1984
-13.566
-0.247
1.86%
jan 1, 1985
-12.442
+1.124
-8.28%
jan 1, 1986
-10.093
+2.349
-18.88%
jan 1, 1987
-3.386
+6.708
-66.46%
jan 1, 1988
-2.983
+0.403
-11.9%
jan 1, 1989
-5.426
-2.443
81.91%
jan 1, 1990
-8.414
-2.988
55.07%
jan 1, 1991
-5.607
+2.807
-33.36%
jan 1, 1992
-10.009
-4.402
78.5%
jan 1, 1993
-11.183
-1.174
11.73%
jan 1, 1994
-0.434
+10.749
-96.12%
jan 1, 1995
-0.397
+0.036
-8.4%
jan 1, 1996
-0.864
-0.466
117.43%
jan 1, 1997
-0.433
+0.43
-49.81%
jan 1, 1998
-1.392
-0.958
221.07%
jan 1, 1999
2.486
+3.877
-278.61%
jan 1, 2000
2.643
+0.158
6.35%
jan 1, 2001
2.43
-0.213
-8.06%
jan 1, 2002
4.569
+2.138
87.98%
jan 1, 2003
1.169
-3.399
-74.4%
jan 1, 2004
1.52
+0.35
29.95%
jan 1, 2005
-0.124
-1.644
-108.17%
jan 1, 2006
-0.533
-0.408
329.1%
jan 1, 2007
-2.935
-2.402
451.01%
jan 1, 2008
-4.757
-1.822
62.09%
jan 1, 2009
-12.765
-8.008
168.34%
jan 1, 2010
-5.347
+7.418
-58.11%
jan 1, 2011
-7.265
-1.918
35.88%
jan 1, 2012
-2.933
+4.332
-59.62%
jan 1, 2013
-1.483
+1.45
-49.44%
jan 1, 2014
1.826
+3.309
-223.11%
jan 1, 2015
2.053
+0.227
12.46%
jan 1, 2016
0.335
-1.719
-83.71%
Ranking of countries by current statistics by years


Comments: