29
/
en
AIzaSyAYiBZKx7MnpbEhh9jyipgxe19OcubqV5w
April 1, 2024
185111
Madagascar
MDG
true
2
1
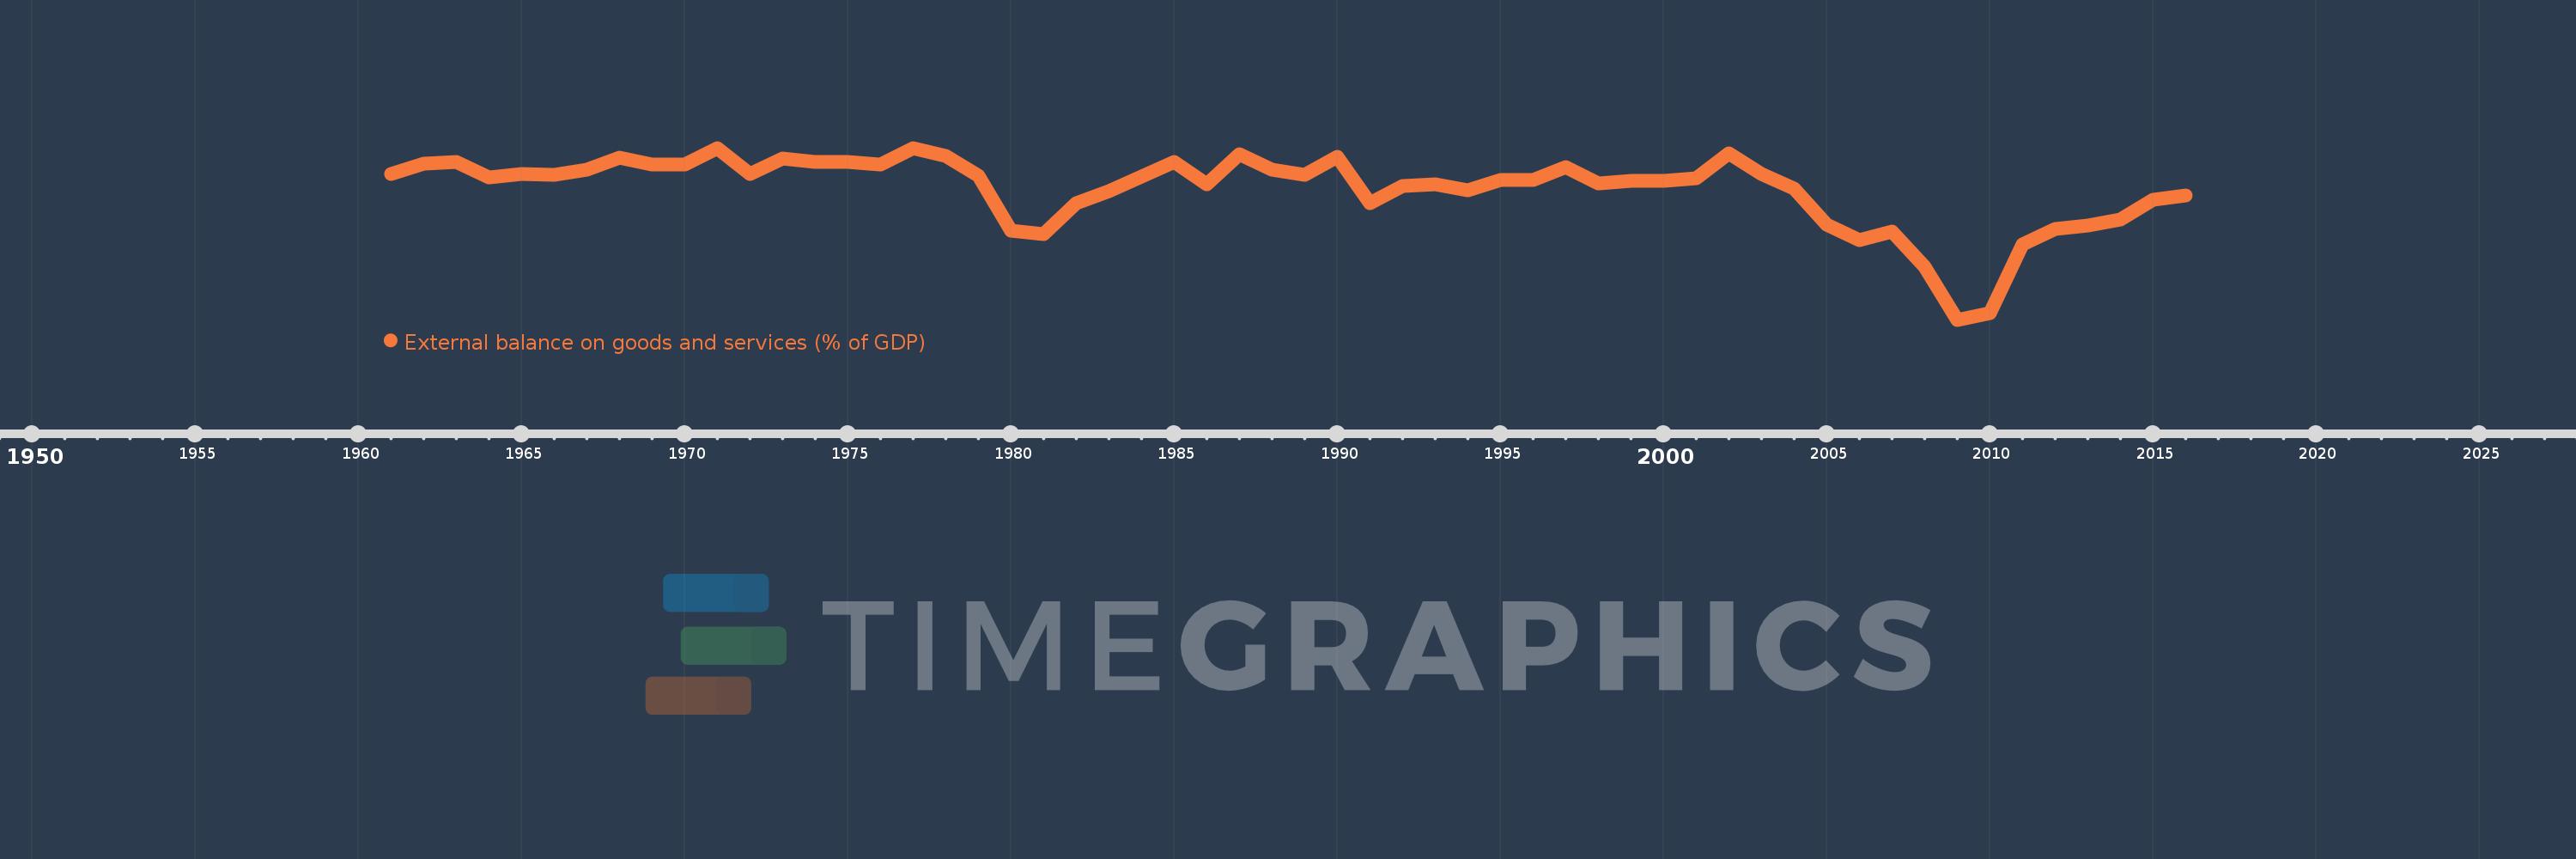
External balance on goods and services (% of GDP)
2016,2015,2014,2013,2012,2011,2010,2009,2008,2007,2006,2005,2004,2003,2002,2001,2000,1999,1998,1997,1996,1995,1994,1993,1992,1991,1990,1989,1988,1987,1986,1985,1984,1983,1982,1981,1980,1979,1978,1977,1976,1975,1974,1973,1972,1971,1970,1969,1968,1967,1966,1965,1964,1963,1962,1961
This statistics in other country:
AfghanistanAlbaniaAlgeriaAngolaAntigua and BarbudaArab WorldArgentinaArmeniaArubaAustraliaAustriaAzerbaijanBahamas, TheBahrainBangladeshBarbadosBelarusBelgiumBelizeBeninBermudaBhutanBoliviaBosnia and HerzegovinaBotswanaBrazilBrunei DarussalamBulgariaBurkina FasoBurundiCabo VerdeCambodiaCameroonCanadaCaribbean small statesCentral African RepublicCentral Europe and the BalticsChadChileChinaColombiaComorosCongo, Dem. Rep.Congo, Rep.Costa RicaCote d'IvoireCroatiaCubaCyprusCzech RepublicDenmarkDjiboutiDominicaDominican RepublicEarly-demographic dividendEast Asia & PacificEast Asia & Pacific (excluding high income)East Asia & Pacific (IDA & IBRD countries)EcuadorEgypt, Arab Rep.El SalvadorEquatorial GuineaEritreaEstoniaEthiopiaEuro areaEurope & Central AsiaEurope & Central Asia (excluding high income)Europe & Central Asia (IDA & IBRD countries)European UnionFaroe IslandsFijiFinlandFragile and conflict affected situationsFranceFrench PolynesiaGabonGambia, TheGeorgiaGermanyGhanaGreeceGrenadaGuatemalaGuineaGuinea-BissauGuyanaHaitiHeavily indebted poor countries (HIPC)High incomeHondurasHong Kong SAR, ChinaHungaryIBRD onlyIcelandIDA & IBRD totalIDA blendIDA onlyIDA totalIndiaIndonesiaIran, Islamic Rep.IraqIrelandIsraelItalyJamaicaJapanJordanKazakhstanKenyaKiribatiKorea, Rep.KosovoKuwaitKyrgyz RepublicLao PDRLate-demographic dividendLatin America & Caribbean Latin America & Caribbean (excluding high income)Latin America & the Caribbean (IDA & IBRD countries)LatviaLeast developed countries: UN classificationLebanonLesothoLiberiaLibyaLithuaniaLow & middle incomeLow incomeLower middle incomeLuxembourgMacao SAR, ChinaMacedonia, FYRMadagascarMalawiMalaysiaMaldivesMaliMaltaMauritaniaMauritiusMexicoMicronesia, Fed. Sts.Middle East & North AfricaMiddle East & North Africa (excluding high income)Middle East & North Africa (IDA & IBRD countries)Middle incomeMoldovaMongoliaMontenegroMoroccoMozambiqueMyanmarNamibiaNepalNetherlandsNew CaledoniaNew ZealandNicaraguaNigerNigeriaNorth AmericaNorwayOECD membersOmanOther small statesPacific island small statesPakistanPalauPanamaPapua New GuineaParaguayPeruPhilippinesPolandPortugalPost-demographic dividendPre-demographic dividendPuerto RicoQatarRomaniaRussian FederationRwandaSamoaSaudi ArabiaSenegalSerbiaSeychellesSierra LeoneSingaporeSlovak RepublicSloveniaSmall statesSolomon IslandsSomaliaSouth AfricaSouth AsiaSouth Asia (IDA & IBRD)South SudanSpainSri LankaSt. Kitts and NevisSt. LuciaSt. Vincent and the GrenadinesSub-Saharan Africa Sub-Saharan Africa (excluding high income)Sub-Saharan Africa (IDA & IBRD countries)SudanSurinameSwazilandSwedenSwitzerlandSyrian Arab RepublicTajikistanTanzaniaThailandTimor-LesteTogoTongaTrinidad and TobagoTunisiaTurkeyTurkmenistanUgandaUkraineUnited Arab EmiratesUnited KingdomUnited StatesUpper middle incomeUruguayUzbekistanVanuatuVenezuela, RBVietnamWest Bank and GazaWorldYemen, Rep.ZambiaZimbabwe Timeline:
This timeline shows a graph from 1961 to 2016 of Madagascar. No data until 1960. Number of actual observations by date: 56.
Source name:
World Development Indicators
Source organization:
World Bank national accounts data, and OECD National Accounts data files.
Categories, topics:
Economy & Growth, Trade
Last updated:
apr 23, 2017
Indicators value changes by year
Minimum:
-30.367
jan 1, 2009
Maximum:
-2.361
jan 1, 1977
At the date of observation
Value
Absolute change
Change from previous value
jan 1, 1961
-6.594
-6.594
0.0%
jan 1, 1962
-4.899
+1.696
-25.72%
jan 1, 1963
-4.628
+0.27
-5.51%
jan 1, 1964
-7.146
-2.517
54.39%
jan 1, 1965
-6.625
+0.521
-7.29%
jan 1, 1966
-6.788
-0.163
2.46%
jan 1, 1967
-5.903
+0.885
-13.04%
jan 1, 1968
-3.99
+1.914
-32.41%
jan 1, 1969
-5.04
-1.05
26.32%
jan 1, 1970
-5.002
+0.038
-0.75%
jan 1, 1971
-2.425
+2.577
-51.52%
jan 1, 1972
-6.581
-4.156
171.35%
jan 1, 1973
-4.06
+2.521
-38.3%
jan 1, 1974
-4.631
-0.571
14.05%
jan 1, 1975
-4.681
-0.05
1.08%
jan 1, 1976
-5.031
-0.35
7.47%
jan 1, 1977
-2.361
+2.67
-53.07%
jan 1, 1978
-3.604
-1.243
52.65%
jan 1, 1979
-6.906
-3.302
91.63%
jan 1, 1980
-15.812
-8.905
128.94%
jan 1, 1981
-16.395
-0.583
3.69%
jan 1, 1982
-11.311
+5.084
-31.01%
jan 1, 1983
-9.441
+1.87
-16.53%
jan 1, 1984
-6.964
+2.478
-26.24%
jan 1, 1985
-4.626
+2.338
-33.57%
jan 1, 1986
-8.266
-3.64
78.7%
jan 1, 1987
-3.398
+4.868
-58.89%
jan 1, 1988
-5.941
-2.543
74.83%
jan 1, 1989
-6.8
-0.858
14.44%
jan 1, 1990
-3.822
+2.978
-43.79%
jan 1, 1991
-11.425
-7.603
198.92%
jan 1, 1992
-8.579
+2.846
-24.91%
jan 1, 1993
-8.283
+0.296
-3.45%
jan 1, 1994
-9.298
-1.014
12.24%
jan 1, 1995
-7.567
+1.731
-18.62%
jan 1, 1996
-7.577
-0.01
0.14%
jan 1, 1997
-5.512
+2.065
-27.26%
jan 1, 1998
-8.094
-2.582
46.84%
jan 1, 1999
-7.757
+0.337
-4.16%
jan 1, 2000
-7.744
+0.013
-0.16%
jan 1, 2001
-7.326
+0.418
-5.4%
jan 1, 2002
-3.214
+4.112
-56.13%
jan 1, 2003
-6.565
-3.352
104.3%
jan 1, 2004
-8.988
-2.422
36.89%
jan 1, 2005
-14.847
-5.86
65.2%
jan 1, 2006
-17.34
-2.493
16.79%
jan 1, 2007
-16.04
+1.3
-7.5%
jan 1, 2008
-21.743
-5.703
35.56%
jan 1, 2009
-30.367
-8.624
39.66%
jan 1, 2010
-29.258
+1.109
-3.65%
jan 1, 2011
-18.074
+11.183
-38.22%
jan 1, 2012
-15.591
+2.484
-13.74%
jan 1, 2013
-14.957
+0.634
-4.07%
jan 1, 2014
-14.094
+0.863
-5.77%
jan 1, 2015
-10.854
+3.24
-22.99%
jan 1, 2016
-10.096
+0.758
-6.98%
Ranking of countries by current statistics by years


Comments: