29
/
en
AIzaSyAYiBZKx7MnpbEhh9jyipgxe19OcubqV5w
April 1, 2024
51820
North America
NAC
false
2
1
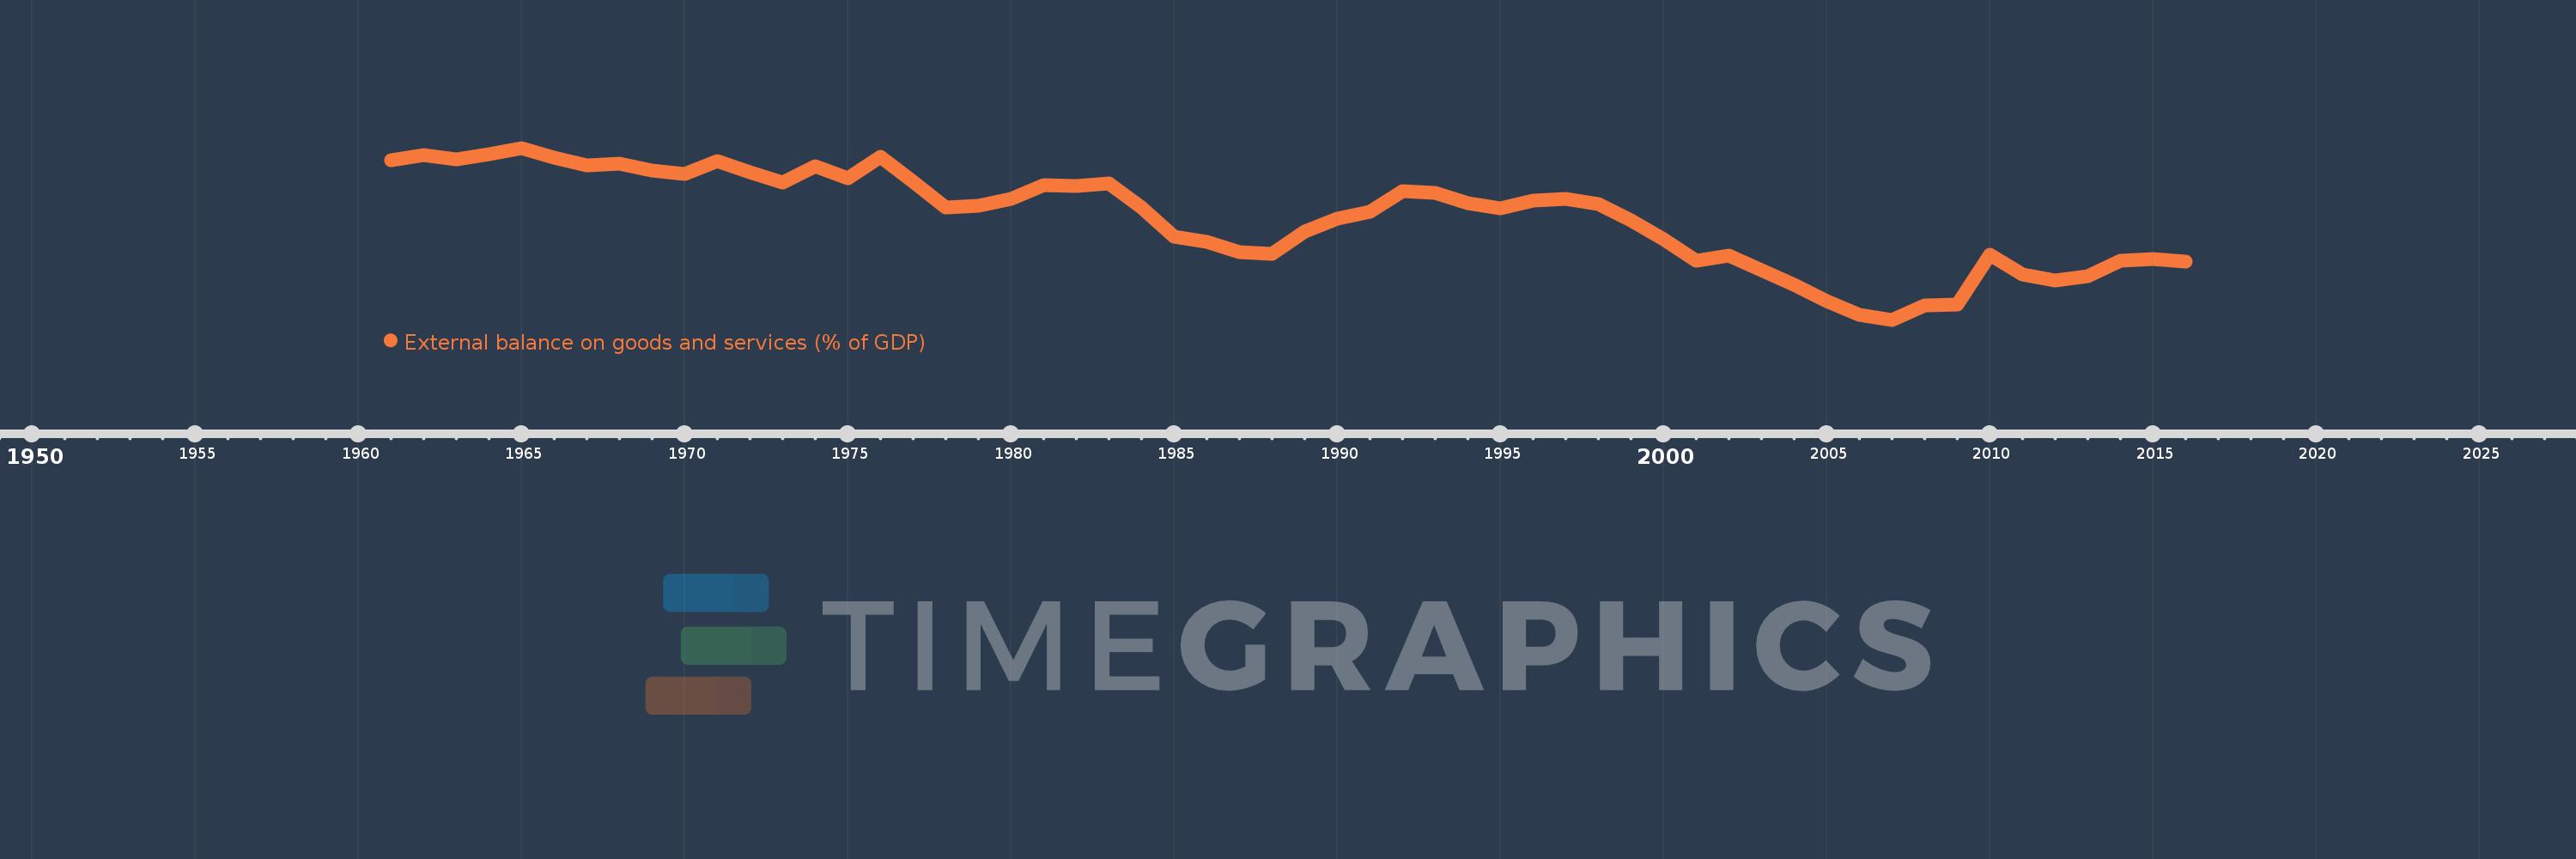
External balance on goods and services (% of GDP)
2016,2015,2014,2013,2012,2011,2010,2009,2008,2007,2006,2005,2004,2003,2002,2001,2000,1999,1998,1997,1996,1995,1994,1993,1992,1991,1990,1989,1988,1987,1986,1985,1984,1983,1982,1981,1980,1979,1978,1977,1976,1975,1974,1973,1972,1971,1970,1969,1968,1967,1966,1965,1964,1963,1962,1961
This statistics in other country:
AfghanistanAlbaniaAlgeriaAngolaAntigua and BarbudaArab WorldArgentinaArmeniaArubaAustraliaAustriaAzerbaijanBahamas, TheBahrainBangladeshBarbadosBelarusBelgiumBelizeBeninBermudaBhutanBoliviaBosnia and HerzegovinaBotswanaBrazilBrunei DarussalamBulgariaBurkina FasoBurundiCabo VerdeCambodiaCameroonCanadaCaribbean small statesCentral African RepublicCentral Europe and the BalticsChadChileChinaColombiaComorosCongo, Dem. Rep.Congo, Rep.Costa RicaCote d'IvoireCroatiaCubaCyprusCzech RepublicDenmarkDjiboutiDominicaDominican RepublicEarly-demographic dividendEast Asia & PacificEast Asia & Pacific (excluding high income)East Asia & Pacific (IDA & IBRD countries)EcuadorEgypt, Arab Rep.El SalvadorEquatorial GuineaEritreaEstoniaEthiopiaEuro areaEurope & Central AsiaEurope & Central Asia (excluding high income)Europe & Central Asia (IDA & IBRD countries)European UnionFaroe IslandsFijiFinlandFragile and conflict affected situationsFranceFrench PolynesiaGabonGambia, TheGeorgiaGermanyGhanaGreeceGrenadaGuatemalaGuineaGuinea-BissauGuyanaHaitiHeavily indebted poor countries (HIPC)High incomeHondurasHong Kong SAR, ChinaHungaryIBRD onlyIcelandIDA & IBRD totalIDA blendIDA onlyIDA totalIndiaIndonesiaIran, Islamic Rep.IraqIrelandIsraelItalyJamaicaJapanJordanKazakhstanKenyaKiribatiKorea, Rep.KosovoKuwaitKyrgyz RepublicLao PDRLate-demographic dividendLatin America & Caribbean Latin America & Caribbean (excluding high income)Latin America & the Caribbean (IDA & IBRD countries)LatviaLeast developed countries: UN classificationLebanonLesothoLiberiaLibyaLithuaniaLow & middle incomeLow incomeLower middle incomeLuxembourgMacao SAR, ChinaMacedonia, FYRMadagascarMalawiMalaysiaMaldivesMaliMaltaMauritaniaMauritiusMexicoMicronesia, Fed. Sts.Middle East & North AfricaMiddle East & North Africa (excluding high income)Middle East & North Africa (IDA & IBRD countries)Middle incomeMoldovaMongoliaMontenegroMoroccoMozambiqueMyanmarNamibiaNepalNetherlandsNew CaledoniaNew ZealandNicaraguaNigerNigeriaNorth AmericaNorwayOECD membersOmanOther small statesPacific island small statesPakistanPalauPanamaPapua New GuineaParaguayPeruPhilippinesPolandPortugalPost-demographic dividendPre-demographic dividendPuerto RicoQatarRomaniaRussian FederationRwandaSamoaSaudi ArabiaSenegalSerbiaSeychellesSierra LeoneSingaporeSlovak RepublicSloveniaSmall statesSolomon IslandsSomaliaSouth AfricaSouth AsiaSouth Asia (IDA & IBRD)South SudanSpainSri LankaSt. Kitts and NevisSt. LuciaSt. Vincent and the GrenadinesSub-Saharan Africa Sub-Saharan Africa (excluding high income)Sub-Saharan Africa (IDA & IBRD countries)SudanSurinameSwazilandSwedenSwitzerlandSyrian Arab RepublicTajikistanTanzaniaThailandTimor-LesteTogoTongaTrinidad and TobagoTunisiaTurkeyTurkmenistanUgandaUkraineUnited Arab EmiratesUnited KingdomUnited StatesUpper middle incomeUruguayUzbekistanVanuatuVenezuela, RBVietnamWest Bank and GazaWorldYemen, Rep.ZambiaZimbabwe Timeline:
This timeline shows a graph from 1961 to 2016 of North America. No data until 1960. Number of actual observations by date: 56.
Source name:
World Development Indicators
Source organization:
World Bank national accounts data, and OECD National Accounts data files.
Categories, topics:
Economy & Growth, Trade
Last updated:
apr 23, 2017
Indicators value changes by year
Minimum:
-4.816
jan 1, 2007
At the date of observation
Value
Absolute change
Change from previous value
jan 1, 1961
0.597
+0.597
0.0%
jan 1, 1962
0.764
+0.167
27.99%
jan 1, 1963
0.615
-0.149
-19.46%
jan 1, 1964
0.785
+0.17
27.59%
jan 1, 1965
1.009
+0.224
28.51%
jan 1, 1966
0.674
-0.335
-33.17%
jan 1, 1967
0.427
-0.247
-36.69%
jan 1, 1968
0.472
+0.045
10.63%
jan 1, 1969
0.236
-0.236
-50.09%
jan 1, 1970
0.134
-0.102
-43.08%
jan 1, 1971
0.564
+0.43
320.89%
jan 1, 1972
0.199
-0.365
-64.72%
jan 1, 1973
-0.154
-0.353
-177.39%
jan 1, 1974
0.392
+0.546
-354.13%
jan 1, 1975
-0.03
-0.422
-107.76%
jan 1, 1976
0.709
+0.739
-2.43K%
jan 1, 1977
-0.138
-0.847
-119.49%
jan 1, 1978
-1.017
-0.879
636.5%
jan 1, 1979
-0.941
+0.077
-7.55%
jan 1, 1980
-0.724
+0.217
-23.07%
jan 1, 1981
-0.244
+0.479
-66.24%
jan 1, 1982
-0.285
-0.04
16.52%
jan 1, 1983
-0.19
+0.094
-33.1%
jan 1, 1984
-0.995
-0.805
422.83%
jan 1, 1985
-1.994
-0.998
100.31%
jan 1, 1986
-2.174
-0.18
9.04%
jan 1, 1987
-2.523
-0.349
16.07%
jan 1, 1988
-2.594
-0.07
2.78%
jan 1, 1989
-1.822
+0.772
-29.75%
jan 1, 1990
-1.389
+0.433
-23.79%
jan 1, 1991
-1.168
+0.221
-15.9%
jan 1, 1992
-0.469
+0.698
-59.81%
jan 1, 1993
-0.515
-0.046
9.85%
jan 1, 1994
-0.86
-0.344
66.78%
jan 1, 1995
-1.045
-0.186
21.58%
jan 1, 1996
-0.782
+0.263
-25.15%
jan 1, 1997
-0.726
+0.056
-7.18%
jan 1, 1998
-0.904
-0.178
24.55%
jan 1, 1999
-1.452
-0.548
60.59%
jan 1, 2000
-2.092
-0.64
44.05%
jan 1, 2001
-2.813
-0.72
34.42%
jan 1, 2002
-2.642
+0.171
-6.07%
jan 1, 2003
-3.139
-0.497
18.81%
jan 1, 2004
-3.632
-0.494
15.73%
jan 1, 2005
-4.188
-0.555
15.28%
jan 1, 2006
-4.656
-0.468
11.18%
jan 1, 2007
-4.816
-0.16
3.44%
jan 1, 2008
-4.321
+0.495
-10.28%
jan 1, 2009
-4.31
+0.01
-0.24%
jan 1, 2010
-2.62
+1.691
-39.23%
jan 1, 2011
-3.28
-0.661
25.22%
jan 1, 2012
-3.498
-0.217
6.63%
jan 1, 2013
-3.353
+0.144
-4.13%
jan 1, 2014
-2.814
+0.539
-16.09%
jan 1, 2015
-2.745
+0.068
-2.43%
jan 1, 2016
-2.841
-0.096
3.48%
Ranking of countries by current statistics by years


Comments: