29
/
en
AIzaSyAYiBZKx7MnpbEhh9jyipgxe19OcubqV5w
April 1, 2024
82882
Belize
BLZ
true
2
1
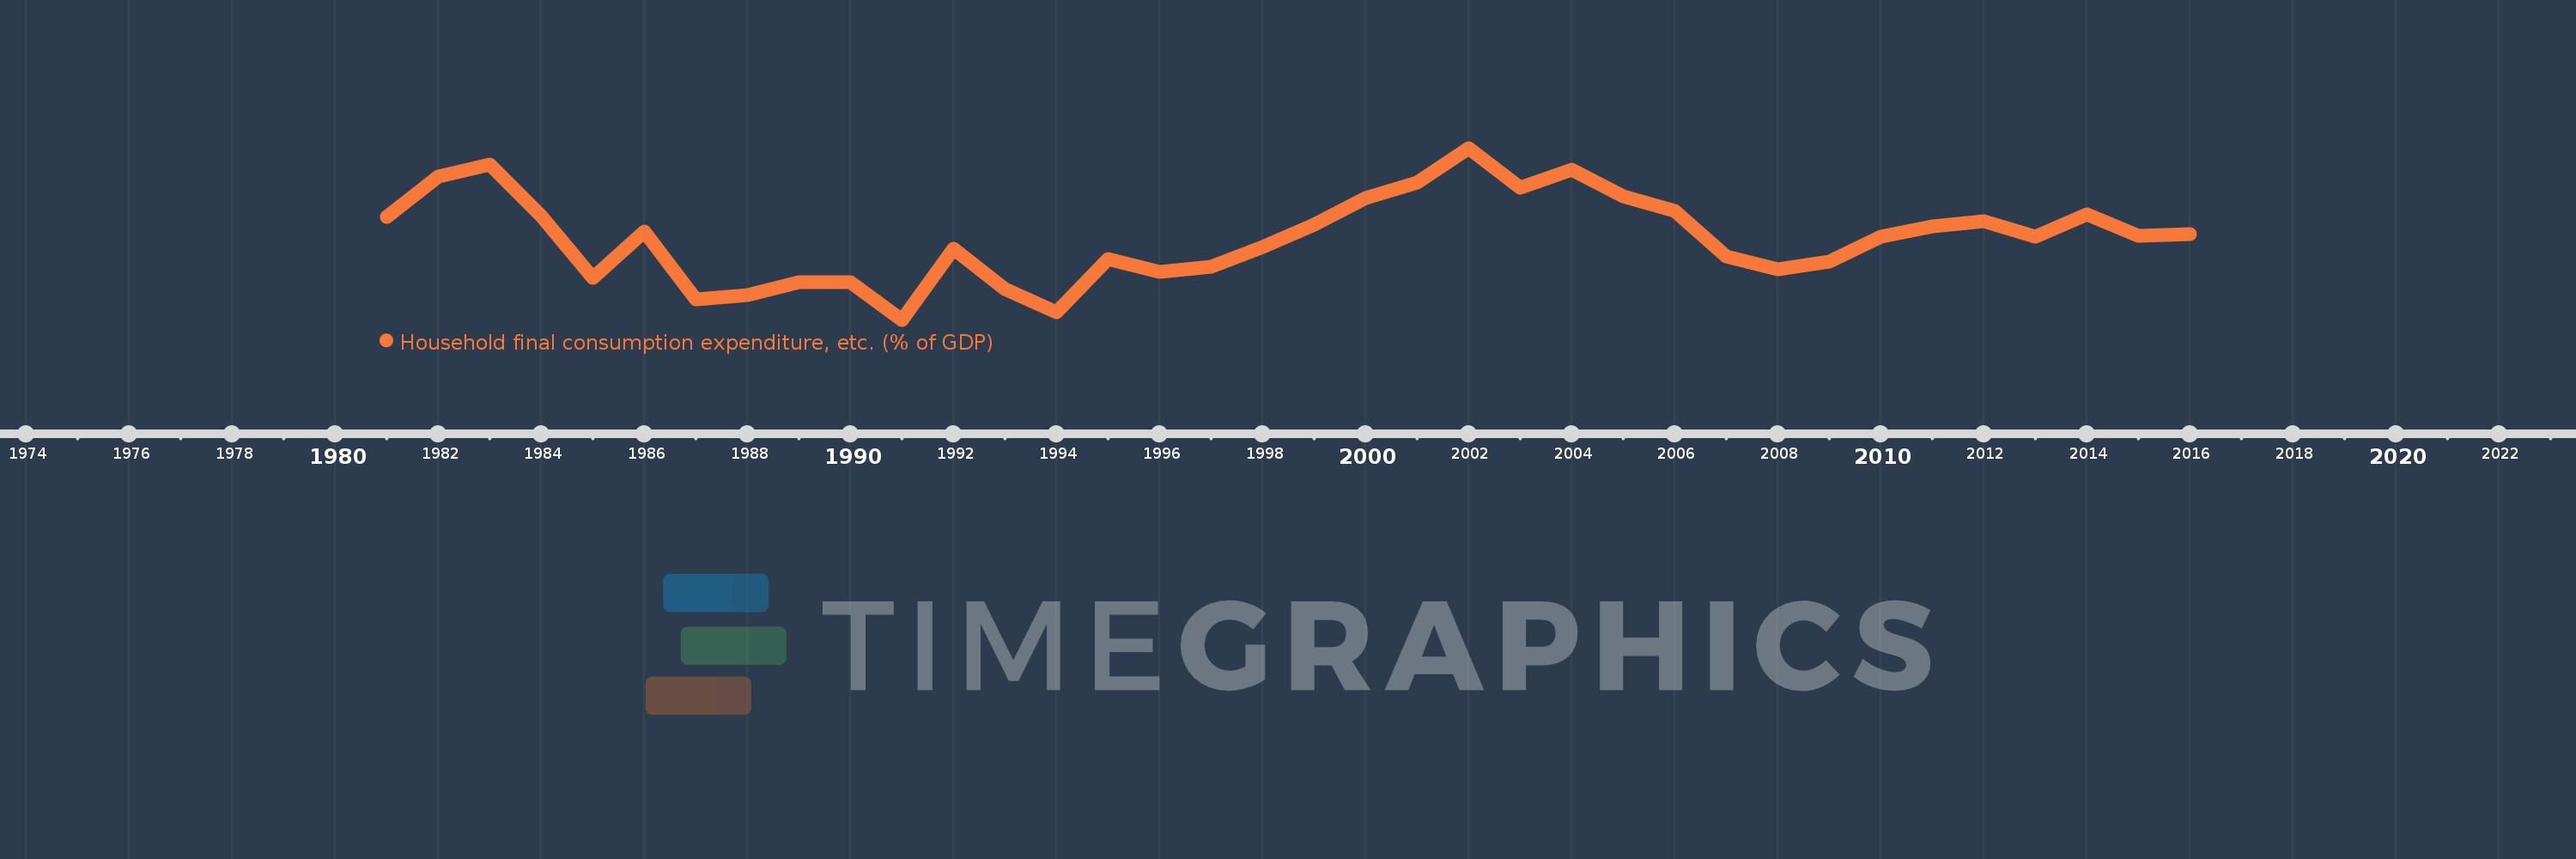
Household final consumption expenditure, etc. (% of GDP)
2016,2015,2014,2013,2012,2011,2010,2009,2008,2007,2006,2005,2004,2003,2002,2001,2000,1999,1998,1997,1996,1995,1994,1993,1992,1991,1990,1989,1988,1987,1986,1985,1984,1983,1982,1981
This statistics in other country:
AfghanistanAlbaniaAlgeriaAngolaAntigua and BarbudaArab WorldArgentinaArmeniaArubaAustraliaAustriaAzerbaijanBahamas, TheBahrainBangladeshBarbadosBelarusBelgiumBelizeBeninBermudaBhutanBoliviaBosnia and HerzegovinaBotswanaBrazilBrunei DarussalamBulgariaBurkina FasoBurundiCabo VerdeCambodiaCameroonCanadaCaribbean small statesCentral African RepublicCentral Europe and the BalticsChadChileChinaColombiaComorosCongo, Dem. Rep.Congo, Rep.Costa RicaCote d'IvoireCroatiaCubaCyprusCzech RepublicDenmarkDjiboutiDominicaDominican RepublicEarly-demographic dividendEast Asia & PacificEast Asia & Pacific (excluding high income)East Asia & Pacific (IDA & IBRD countries)EcuadorEgypt, Arab Rep.El SalvadorEquatorial GuineaEritreaEstoniaEthiopiaEuro areaEurope & Central AsiaEurope & Central Asia (excluding high income)Europe & Central Asia (IDA & IBRD countries)European UnionFaroe IslandsFijiFinlandFragile and conflict affected situationsFranceGabonGambia, TheGeorgiaGermanyGhanaGreeceGrenadaGuatemalaGuineaGuinea-BissauGuyanaHaitiHeavily indebted poor countries (HIPC)High incomeHondurasHong Kong SAR, ChinaHungaryIBRD onlyIcelandIDA & IBRD totalIDA blendIDA onlyIDA totalIndiaIndonesiaIran, Islamic Rep.IraqIrelandIsraelItalyJamaicaJapanJordanKazakhstanKenyaKiribatiKorea, Rep.KosovoKuwaitKyrgyz RepublicLao PDRLate-demographic dividendLatin America & Caribbean Latin America & Caribbean (excluding high income)Latin America & the Caribbean (IDA & IBRD countries)LatviaLeast developed countries: UN classificationLebanonLesothoLiberiaLibyaLithuaniaLow & middle incomeLow incomeLower middle incomeLuxembourgMacao SAR, ChinaMacedonia, FYRMadagascarMalawiMalaysiaMaldivesMaliMaltaMauritaniaMauritiusMexicoMicronesia, Fed. Sts.Middle East & North AfricaMiddle East & North Africa (excluding high income)Middle East & North Africa (IDA & IBRD countries)Middle incomeMoldovaMongoliaMontenegroMoroccoMozambiqueNamibiaNepalNetherlandsNew CaledoniaNew ZealandNicaraguaNigerNigeriaNorth AmericaNorwayOECD membersOmanOther small statesPacific island small statesPakistanPanamaPapua New GuineaParaguayPeruPhilippinesPolandPortugalPost-demographic dividendPre-demographic dividendPuerto RicoQatarRomaniaRussian FederationRwandaSaudi ArabiaSenegalSerbiaSeychellesSierra LeoneSingaporeSlovak RepublicSloveniaSmall statesSolomon IslandsSomaliaSouth AfricaSouth AsiaSouth Asia (IDA & IBRD)South SudanSpainSri LankaSt. Kitts and NevisSt. LuciaSt. Vincent and the GrenadinesSub-Saharan Africa Sub-Saharan Africa (excluding high income)Sub-Saharan Africa (IDA & IBRD countries)SudanSurinameSwazilandSwedenSwitzerlandSyrian Arab RepublicTajikistanTanzaniaThailandTimor-LesteTogoTongaTrinidad and TobagoTunisiaTurkeyTurkmenistanUgandaUkraineUnited Arab EmiratesUnited KingdomUnited StatesUpper middle incomeUruguayUzbekistanVanuatuVenezuela, RBVietnamWest Bank and GazaWorldYemen, Rep.ZambiaZimbabwe Timeline:
This timeline shows a graph from 1981 to 2016 of Belize. No data until 1980. Number of actual observations by date: 36.
Source name:
World Development Indicators
Source organization:
World Bank national accounts data, and OECD National Accounts data files.
Categories, topics:
Economy & Growth
Last updated:
apr 23, 2017
Indicators value changes by year
Minimum:
59.266
jan 1, 1991
Maximum:
80.352
jan 1, 2002
At the date of observation
Value
Absolute change
Change from previous value
jan 1, 1981
71.938
+71.938
0.0%
jan 1, 1982
76.879
+4.941
6.87%
jan 1, 1983
78.354
+1.475
1.92%
jan 1, 1984
71.984
-6.37
-8.13%
jan 1, 1985
64.367
-7.617
-10.58%
jan 1, 1986
70.093
+5.726
8.9%
jan 1, 1987
61.751
-8.342
-11.9%
jan 1, 1988
62.34
+0.588
0.95%
jan 1, 1989
63.877
+1.538
2.47%
jan 1, 1990
63.899
+0.022
0.03%
jan 1, 1991
59.266
-4.633
-7.25%
jan 1, 1992
68.002
+8.736
14.74%
jan 1, 1993
63.048
-4.955
-7.29%
jan 1, 1994
60.173
-2.875
-4.56%
jan 1, 1995
66.768
+6.595
10.96%
jan 1, 1996
65.161
-1.606
-2.41%
jan 1, 1997
65.769
+0.608
0.93%
jan 1, 1998
68.226
+2.457
3.74%
jan 1, 1999
70.944
+2.718
3.98%
jan 1, 2000
74.207
+3.263
4.6%
jan 1, 2001
76.085
+1.878
2.53%
jan 1, 2002
80.352
+4.267
5.61%
jan 1, 2003
75.433
-4.918
-6.12%
jan 1, 2004
77.637
+2.204
2.92%
jan 1, 2005
74.441
-3.196
-4.12%
jan 1, 2006
72.664
-1.777
-2.39%
jan 1, 2007
67.032
-5.631
-7.75%
jan 1, 2008
65.476
-1.556
-2.32%
jan 1, 2009
66.453
+0.976
1.49%
jan 1, 2010
69.449
+2.996
4.51%
jan 1, 2011
70.704
+1.255
1.81%
jan 1, 2012
71.358
+0.654
0.93%
jan 1, 2013
69.511
-1.847
-2.59%
jan 1, 2014
72.203
+2.693
3.87%
jan 1, 2015
69.575
-2.628
-3.64%
jan 1, 2016
69.828
+0.252
0.36%
Ranking of countries by current statistics by years


Comments: