29
/
en
AIzaSyAYiBZKx7MnpbEhh9jyipgxe19OcubqV5w
April 1, 2024
24962
Caribbean small states
CSS
false
2
1
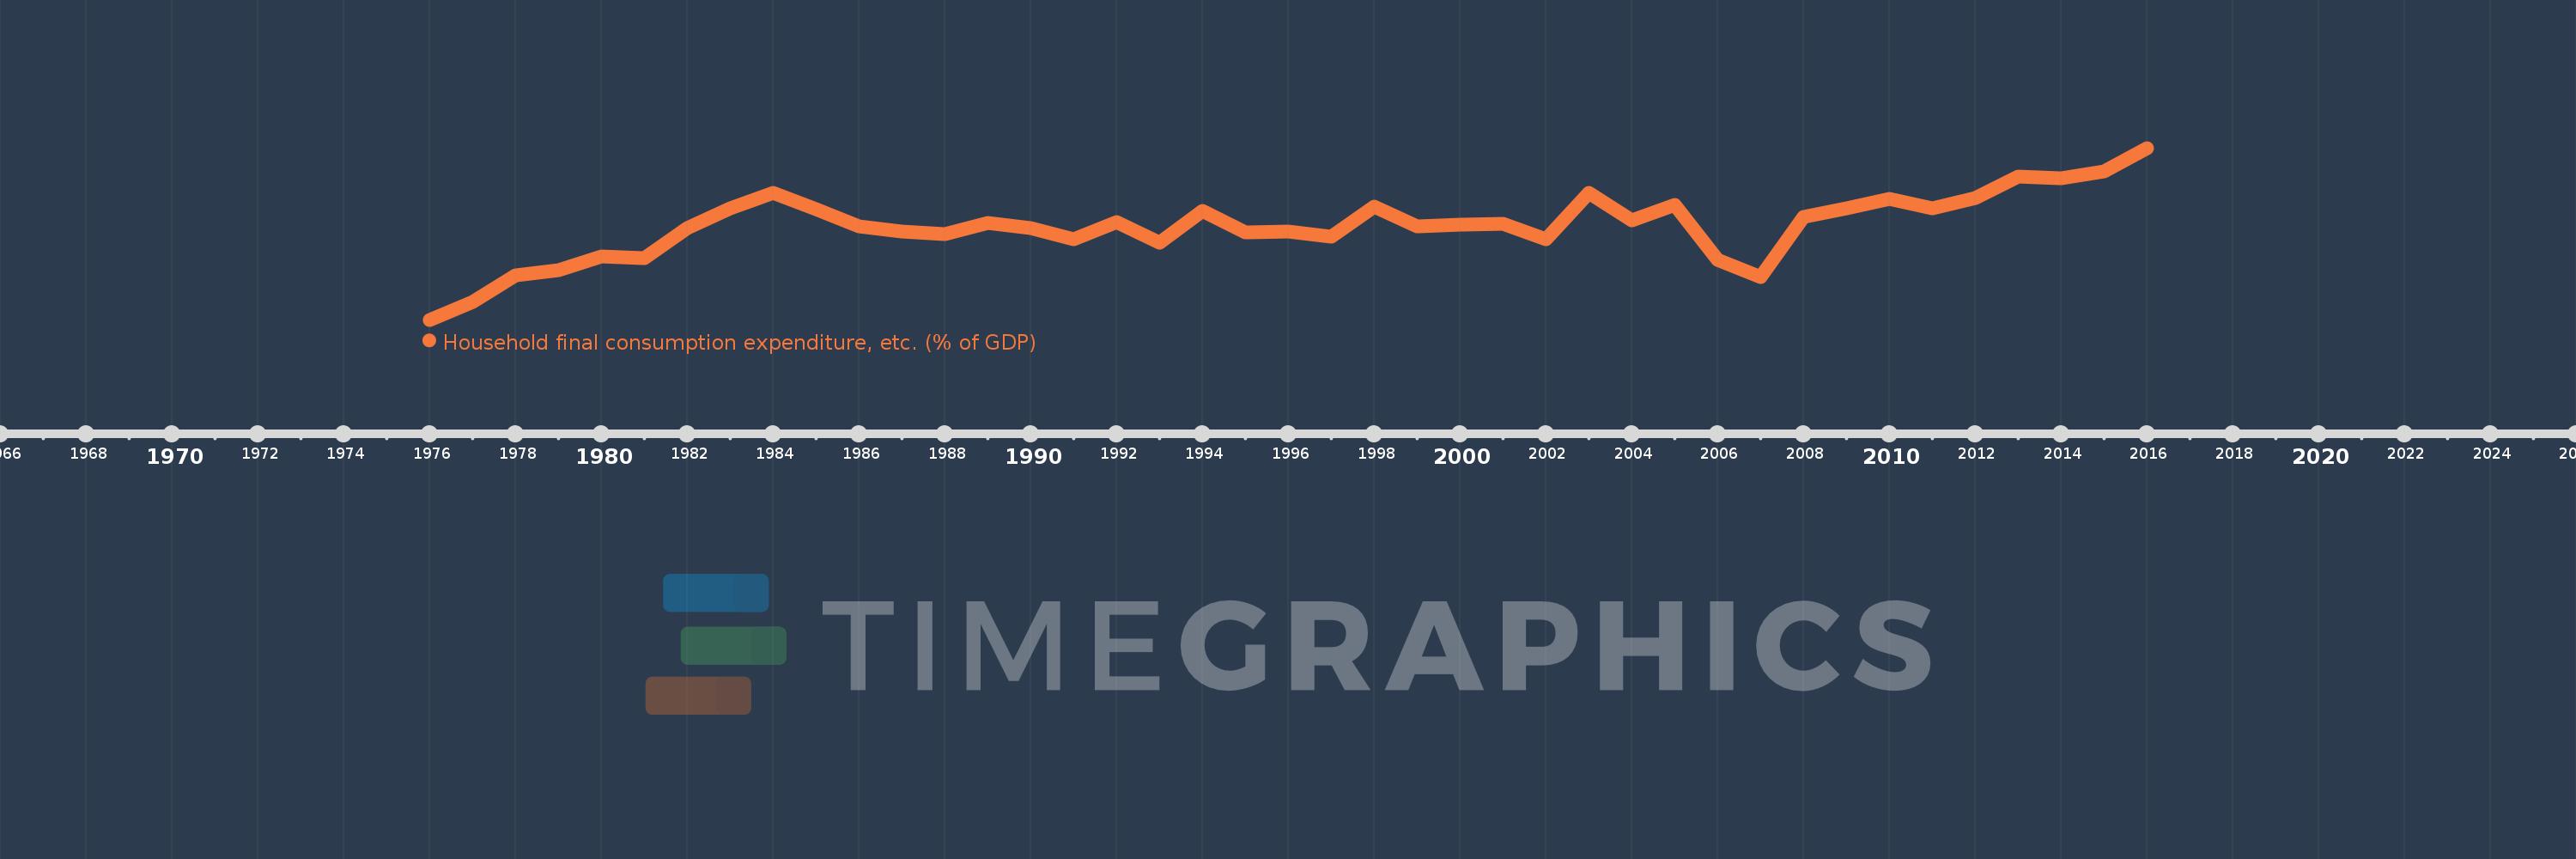
Household final consumption expenditure, etc. (% of GDP)
2016,2015,2014,2013,2012,2011,2010,2009,2008,2007,2006,2005,2004,2003,2002,2001,2000,1999,1998,1997,1996,1995,1994,1993,1992,1991,1990,1989,1988,1987,1986,1985,1984,1983,1982,1981,1980,1979,1978,1977,1976
This statistics in other country:
AfghanistanAlbaniaAlgeriaAngolaAntigua and BarbudaArab WorldArgentinaArmeniaArubaAustraliaAustriaAzerbaijanBahamas, TheBahrainBangladeshBarbadosBelarusBelgiumBelizeBeninBermudaBhutanBoliviaBosnia and HerzegovinaBotswanaBrazilBrunei DarussalamBulgariaBurkina FasoBurundiCabo VerdeCambodiaCameroonCanadaCaribbean small statesCentral African RepublicCentral Europe and the BalticsChadChileChinaColombiaComorosCongo, Dem. Rep.Congo, Rep.Costa RicaCote d'IvoireCroatiaCubaCyprusCzech RepublicDenmarkDjiboutiDominicaDominican RepublicEarly-demographic dividendEast Asia & PacificEast Asia & Pacific (excluding high income)East Asia & Pacific (IDA & IBRD countries)EcuadorEgypt, Arab Rep.El SalvadorEquatorial GuineaEritreaEstoniaEthiopiaEuro areaEurope & Central AsiaEurope & Central Asia (excluding high income)Europe & Central Asia (IDA & IBRD countries)European UnionFaroe IslandsFijiFinlandFragile and conflict affected situationsFranceGabonGambia, TheGeorgiaGermanyGhanaGreeceGrenadaGuatemalaGuineaGuinea-BissauGuyanaHaitiHeavily indebted poor countries (HIPC)High incomeHondurasHong Kong SAR, ChinaHungaryIBRD onlyIcelandIDA & IBRD totalIDA blendIDA onlyIDA totalIndiaIndonesiaIran, Islamic Rep.IraqIrelandIsraelItalyJamaicaJapanJordanKazakhstanKenyaKiribatiKorea, Rep.KosovoKuwaitKyrgyz RepublicLao PDRLate-demographic dividendLatin America & Caribbean Latin America & Caribbean (excluding high income)Latin America & the Caribbean (IDA & IBRD countries)LatviaLeast developed countries: UN classificationLebanonLesothoLiberiaLibyaLithuaniaLow & middle incomeLow incomeLower middle incomeLuxembourgMacao SAR, ChinaMacedonia, FYRMadagascarMalawiMalaysiaMaldivesMaliMaltaMauritaniaMauritiusMexicoMicronesia, Fed. Sts.Middle East & North AfricaMiddle East & North Africa (excluding high income)Middle East & North Africa (IDA & IBRD countries)Middle incomeMoldovaMongoliaMontenegroMoroccoMozambiqueNamibiaNepalNetherlandsNew CaledoniaNew ZealandNicaraguaNigerNigeriaNorth AmericaNorwayOECD membersOmanOther small statesPacific island small statesPakistanPanamaPapua New GuineaParaguayPeruPhilippinesPolandPortugalPost-demographic dividendPre-demographic dividendPuerto RicoQatarRomaniaRussian FederationRwandaSaudi ArabiaSenegalSerbiaSeychellesSierra LeoneSingaporeSlovak RepublicSloveniaSmall statesSolomon IslandsSomaliaSouth AfricaSouth AsiaSouth Asia (IDA & IBRD)South SudanSpainSri LankaSt. Kitts and NevisSt. LuciaSt. Vincent and the GrenadinesSub-Saharan Africa Sub-Saharan Africa (excluding high income)Sub-Saharan Africa (IDA & IBRD countries)SudanSurinameSwazilandSwedenSwitzerlandSyrian Arab RepublicTajikistanTanzaniaThailandTimor-LesteTogoTongaTrinidad and TobagoTunisiaTurkeyTurkmenistanUgandaUkraineUnited Arab EmiratesUnited KingdomUnited StatesUpper middle incomeUruguayUzbekistanVanuatuVenezuela, RBVietnamWest Bank and GazaWorldYemen, Rep.ZambiaZimbabwe Timeline:
This timeline shows a graph from 1976 to 2016 of Caribbean small states. No data until 1975. Number of actual observations by date: 41.
Source name:
World Development Indicators
Source organization:
World Bank national accounts data, and OECD National Accounts data files.
Categories, topics:
Economy & Growth
Last updated:
apr 23, 2017
Indicators value changes by year
Minimum:
50.498
jan 1, 1976
At the date of observation
Value
Absolute change
Change from previous value
jan 1, 1976
50.498
+50.498
0.0%
jan 1, 1977
52.677
+2.179
4.31%
jan 1, 1978
55.861
+3.184
6.04%
jan 1, 1979
56.475
+0.614
1.1%
jan 1, 1980
58.196
+1.721
3.05%
jan 1, 1981
58.016
-0.179
-0.31%
jan 1, 1982
61.592
+3.576
6.16%
jan 1, 1983
64.013
+2.42
3.93%
jan 1, 1984
65.884
+1.871
2.92%
jan 1, 1985
63.95
-1.933
-2.93%
jan 1, 1986
61.859
-2.091
-3.27%
jan 1, 1987
61.182
-0.677
-1.09%
jan 1, 1988
60.852
-0.33
-0.54%
jan 1, 1989
62.244
+1.392
2.29%
jan 1, 1990
61.599
-0.646
-1.04%
jan 1, 1991
60.241
-1.357
-2.2%
jan 1, 1992
62.324
+2.082
3.46%
jan 1, 1993
59.893
-2.431
-3.9%
jan 1, 1994
63.693
+3.8
6.34%
jan 1, 1995
61.115
-2.578
-4.05%
jan 1, 1996
61.245
+0.13
0.21%
jan 1, 1997
60.617
-0.629
-1.03%
jan 1, 1998
64.24
+3.624
5.98%
jan 1, 1999
61.818
-2.423
-3.77%
jan 1, 2000
62.04
+0.222
0.36%
jan 1, 2001
62.18
+0.14
0.23%
jan 1, 2002
60.296
-1.884
-3.03%
jan 1, 2003
65.858
+5.562
9.22%
jan 1, 2004
62.518
-3.339
-5.07%
jan 1, 2005
64.399
+1.881
3.01%
jan 1, 2006
57.729
-6.67
-10.36%
jan 1, 2007
55.711
-2.018
-3.5%
jan 1, 2008
62.986
+7.275
13.06%
jan 1, 2009
64.025
+1.039
1.65%
jan 1, 2010
65.21
+1.185
1.85%
jan 1, 2011
63.988
-1.222
-1.87%
jan 1, 2012
65.306
+1.318
2.06%
jan 1, 2013
67.865
+2.559
3.92%
jan 1, 2014
67.647
-0.218
-0.32%
jan 1, 2015
68.473
+0.826
1.22%
jan 1, 2016
71.34
+2.867
4.19%
Ranking of countries by current statistics by years


Comments: