29
/
en
AIzaSyAYiBZKx7MnpbEhh9jyipgxe19OcubqV5w
April 1, 2024
45152
Low & middle income
LMY
false
2
1
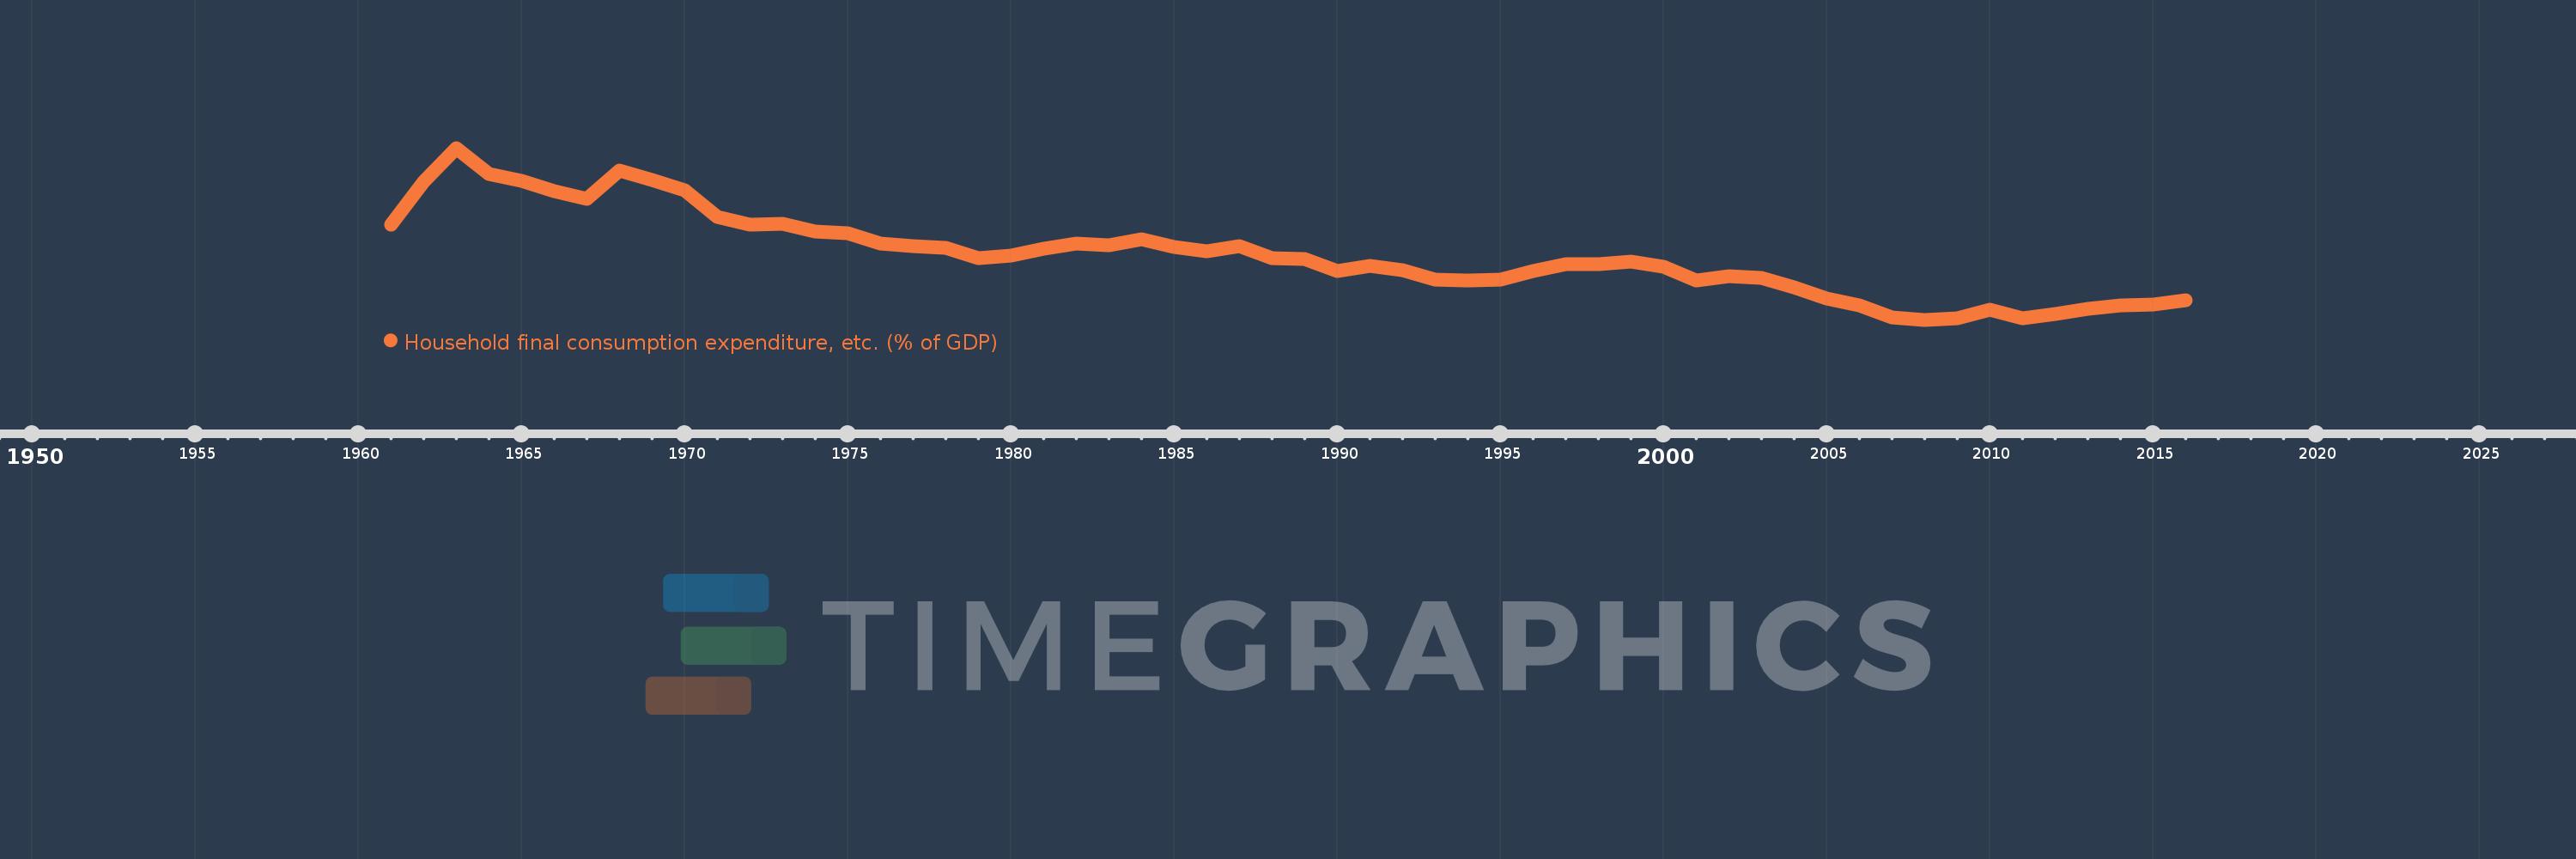
Household final consumption expenditure, etc. (% of GDP)
2016,2015,2014,2013,2012,2011,2010,2009,2008,2007,2006,2005,2004,2003,2002,2001,2000,1999,1998,1997,1996,1995,1994,1993,1992,1991,1990,1989,1988,1987,1986,1985,1984,1983,1982,1981,1980,1979,1978,1977,1976,1975,1974,1973,1972,1971,1970,1969,1968,1967,1966,1965,1964,1963,1962,1961
This statistics in other country:
AfghanistanAlbaniaAlgeriaAngolaAntigua and BarbudaArab WorldArgentinaArmeniaArubaAustraliaAustriaAzerbaijanBahamas, TheBahrainBangladeshBarbadosBelarusBelgiumBelizeBeninBermudaBhutanBoliviaBosnia and HerzegovinaBotswanaBrazilBrunei DarussalamBulgariaBurkina FasoBurundiCabo VerdeCambodiaCameroonCanadaCaribbean small statesCentral African RepublicCentral Europe and the BalticsChadChileChinaColombiaComorosCongo, Dem. Rep.Congo, Rep.Costa RicaCote d'IvoireCroatiaCubaCyprusCzech RepublicDenmarkDjiboutiDominicaDominican RepublicEarly-demographic dividendEast Asia & PacificEast Asia & Pacific (excluding high income)East Asia & Pacific (IDA & IBRD countries)EcuadorEgypt, Arab Rep.El SalvadorEquatorial GuineaEritreaEstoniaEthiopiaEuro areaEurope & Central AsiaEurope & Central Asia (excluding high income)Europe & Central Asia (IDA & IBRD countries)European UnionFaroe IslandsFijiFinlandFragile and conflict affected situationsFranceGabonGambia, TheGeorgiaGermanyGhanaGreeceGrenadaGuatemalaGuineaGuinea-BissauGuyanaHaitiHeavily indebted poor countries (HIPC)High incomeHondurasHong Kong SAR, ChinaHungaryIBRD onlyIcelandIDA & IBRD totalIDA blendIDA onlyIDA totalIndiaIndonesiaIran, Islamic Rep.IraqIrelandIsraelItalyJamaicaJapanJordanKazakhstanKenyaKiribatiKorea, Rep.KosovoKuwaitKyrgyz RepublicLao PDRLate-demographic dividendLatin America & Caribbean Latin America & Caribbean (excluding high income)Latin America & the Caribbean (IDA & IBRD countries)LatviaLeast developed countries: UN classificationLebanonLesothoLiberiaLibyaLithuaniaLow & middle incomeLow incomeLower middle incomeLuxembourgMacao SAR, ChinaMacedonia, FYRMadagascarMalawiMalaysiaMaldivesMaliMaltaMauritaniaMauritiusMexicoMicronesia, Fed. Sts.Middle East & North AfricaMiddle East & North Africa (excluding high income)Middle East & North Africa (IDA & IBRD countries)Middle incomeMoldovaMongoliaMontenegroMoroccoMozambiqueNamibiaNepalNetherlandsNew CaledoniaNew ZealandNicaraguaNigerNigeriaNorth AmericaNorwayOECD membersOmanOther small statesPacific island small statesPakistanPanamaPapua New GuineaParaguayPeruPhilippinesPolandPortugalPost-demographic dividendPre-demographic dividendPuerto RicoQatarRomaniaRussian FederationRwandaSaudi ArabiaSenegalSerbiaSeychellesSierra LeoneSingaporeSlovak RepublicSloveniaSmall statesSolomon IslandsSomaliaSouth AfricaSouth AsiaSouth Asia (IDA & IBRD)South SudanSpainSri LankaSt. Kitts and NevisSt. LuciaSt. Vincent and the GrenadinesSub-Saharan Africa Sub-Saharan Africa (excluding high income)Sub-Saharan Africa (IDA & IBRD countries)SudanSurinameSwazilandSwedenSwitzerlandSyrian Arab RepublicTajikistanTanzaniaThailandTimor-LesteTogoTongaTrinidad and TobagoTunisiaTurkeyTurkmenistanUgandaUkraineUnited Arab EmiratesUnited KingdomUnited StatesUpper middle incomeUruguayUzbekistanVanuatuVenezuela, RBVietnamWest Bank and GazaWorldYemen, Rep.ZambiaZimbabwe Timeline:
This timeline shows a graph from 1961 to 2016 of Low & middle income. No data until 1960. Number of actual observations by date: 56.
Source name:
World Development Indicators
Source organization:
World Bank national accounts data, and OECD National Accounts data files.
Categories, topics:
Economy & Growth
Last updated:
apr 23, 2017
Indicators value changes by year
Minimum:
52.407
jan 1, 2008
Maximum:
72.356
jan 1, 1963
At the date of observation
Value
Absolute change
Change from previous value
jan 1, 1961
63.425
+63.425
0.0%
jan 1, 1962
68.458
+5.033
7.93%
jan 1, 1963
72.356
+3.898
5.69%
jan 1, 1964
69.326
-3.029
-4.19%
jan 1, 1965
68.511
-0.815
-1.18%
jan 1, 1966
67.374
-1.137
-1.66%
jan 1, 1967
66.435
-0.939
-1.39%
jan 1, 1968
69.742
+3.307
4.98%
jan 1, 1969
68.673
-1.069
-1.53%
jan 1, 1970
67.472
-1.202
-1.75%
jan 1, 1971
64.395
-3.077
-4.56%
jan 1, 1972
63.413
-0.982
-1.53%
jan 1, 1973
63.594
+0.181
0.29%
jan 1, 1974
62.633
-0.961
-1.51%
jan 1, 1975
62.412
-0.221
-0.35%
jan 1, 1976
61.272
-1.14
-1.83%
jan 1, 1977
60.949
-0.323
-0.53%
jan 1, 1978
60.755
-0.194
-0.32%
jan 1, 1979
59.529
-1.226
-2.02%
jan 1, 1980
59.886
+0.357
0.6%
jan 1, 1981
60.614
+0.728
1.22%
jan 1, 1982
61.252
+0.638
1.05%
jan 1, 1983
61.084
-0.168
-0.27%
jan 1, 1984
61.792
+0.708
1.16%
jan 1, 1985
60.87
-0.922
-1.49%
jan 1, 1986
60.38
-0.49
-0.8%
jan 1, 1987
60.995
+0.615
1.02%
jan 1, 1988
59.524
-1.471
-2.41%
jan 1, 1989
59.501
-0.023
-0.04%
jan 1, 1990
58.056
-1.445
-2.43%
jan 1, 1991
58.698
+0.642
1.11%
jan 1, 1992
58.205
-0.493
-0.84%
jan 1, 1993
57.019
-1.186
-2.04%
jan 1, 1994
56.961
-0.058
-0.1%
jan 1, 1995
57.079
+0.118
0.21%
jan 1, 1996
58.106
+1.027
1.8%
jan 1, 1997
58.849
+0.743
1.28%
jan 1, 1998
58.817
-0.032
-0.05%
jan 1, 1999
59.128
+0.311
0.53%
jan 1, 2000
58.553
-0.575
-0.97%
jan 1, 2001
56.993
-1.56
-2.66%
jan 1, 2002
57.512
+0.518
0.91%
jan 1, 2003
57.266
-0.246
-0.43%
jan 1, 2004
56.133
-1.133
-1.98%
jan 1, 2005
54.855
-1.278
-2.28%
jan 1, 2006
54.077
-0.778
-1.42%
jan 1, 2007
52.655
-1.422
-2.63%
jan 1, 2008
52.407
-0.248
-0.47%
jan 1, 2009
52.533
+0.126
0.24%
jan 1, 2010
53.592
+1.059
2.02%
jan 1, 2011
52.599
-0.993
-1.85%
jan 1, 2012
53.039
+0.44
0.84%
jan 1, 2013
53.658
+0.619
1.17%
jan 1, 2014
54.052
+0.394
0.73%
jan 1, 2015
54.221
+0.169
0.31%
jan 1, 2016
54.653
+0.432
0.8%
Ranking of countries by current statistics by years


Comments: