29
/
en
AIzaSyAYiBZKx7MnpbEhh9jyipgxe19OcubqV5w
April 1, 2024
140487
Ghana
GHA
true
2
1
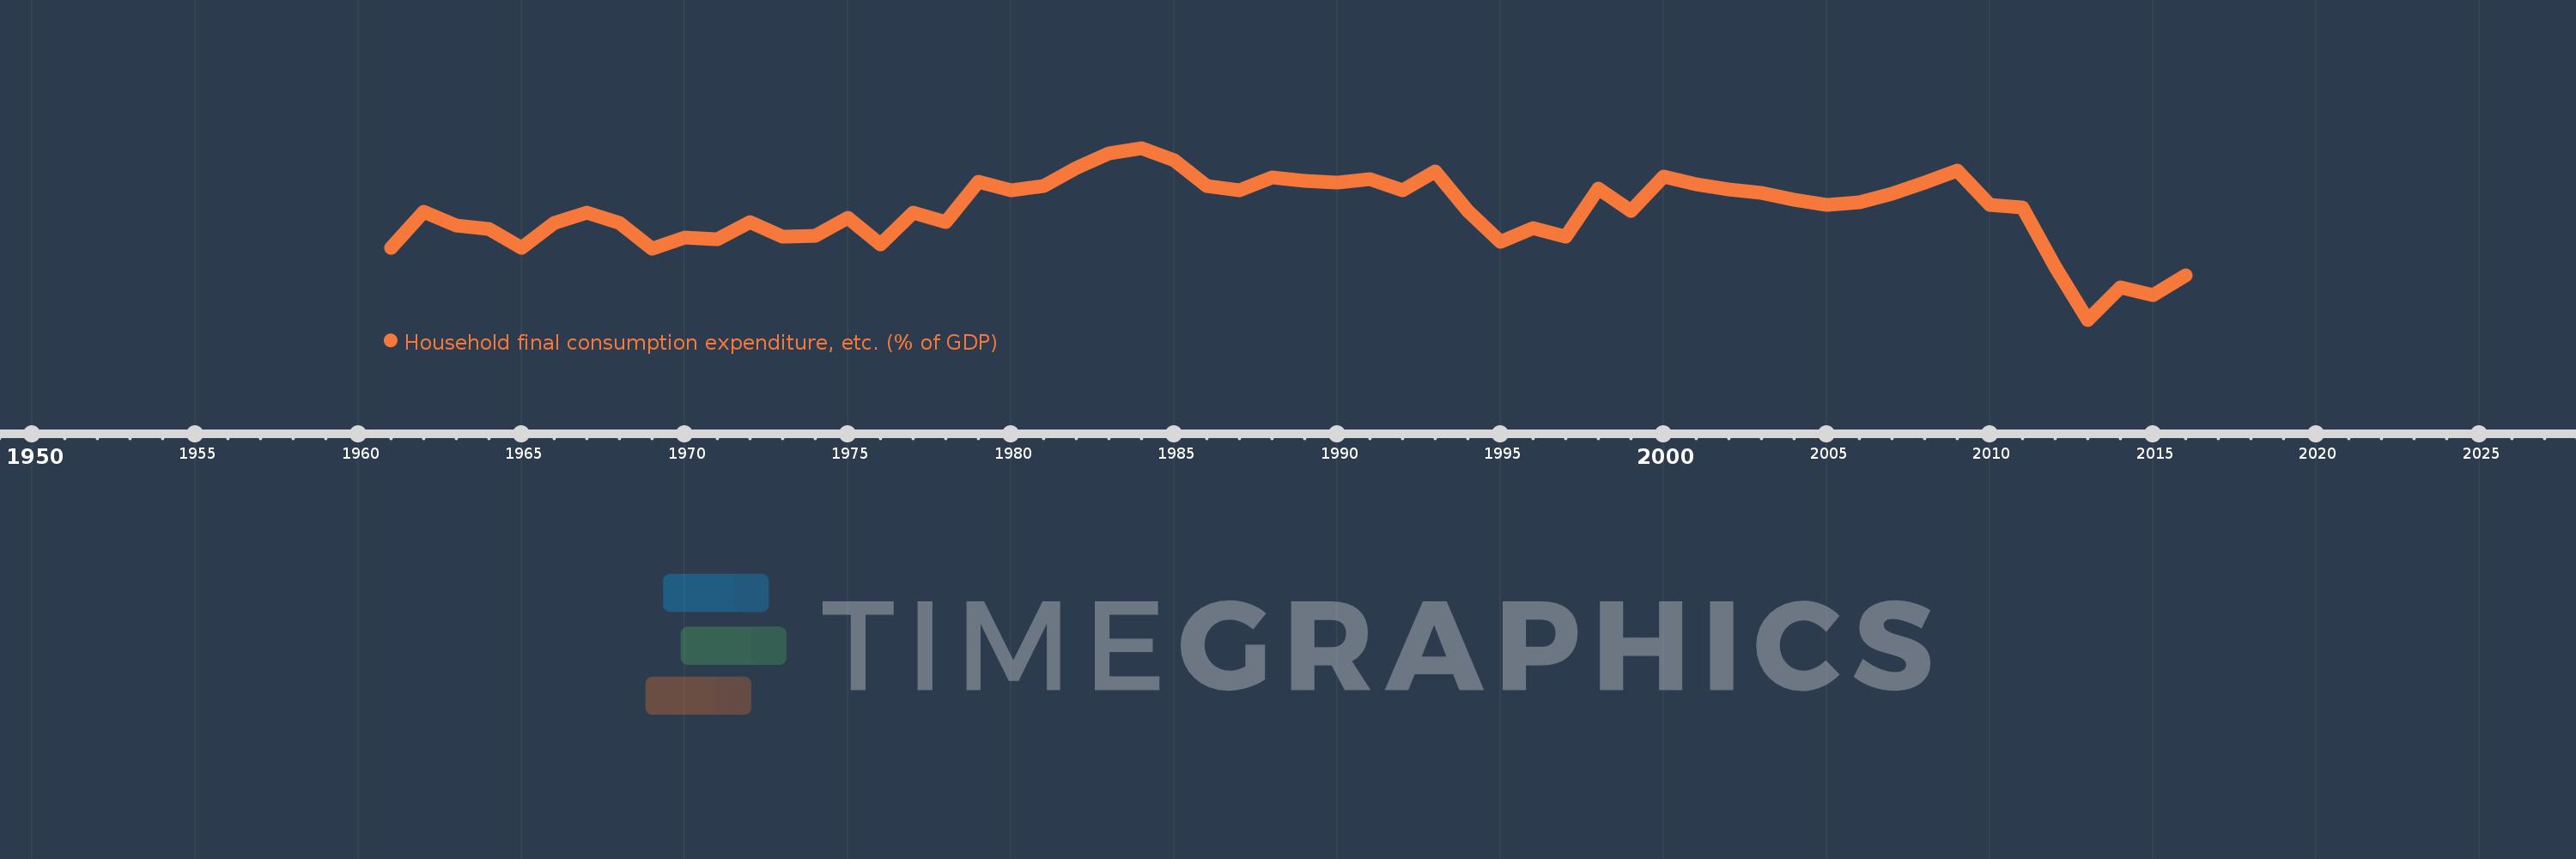
Household final consumption expenditure, etc. (% of GDP)
2016,2015,2014,2013,2012,2011,2010,2009,2008,2007,2006,2005,2004,2003,2002,2001,2000,1999,1998,1997,1996,1995,1994,1993,1992,1991,1990,1989,1988,1987,1986,1985,1984,1983,1982,1981,1980,1979,1978,1977,1976,1975,1974,1973,1972,1971,1970,1969,1968,1967,1966,1965,1964,1963,1962,1961
This statistics in other country:
AfghanistanAlbaniaAlgeriaAngolaAntigua and BarbudaArab WorldArgentinaArmeniaArubaAustraliaAustriaAzerbaijanBahamas, TheBahrainBangladeshBarbadosBelarusBelgiumBelizeBeninBermudaBhutanBoliviaBosnia and HerzegovinaBotswanaBrazilBrunei DarussalamBulgariaBurkina FasoBurundiCabo VerdeCambodiaCameroonCanadaCaribbean small statesCentral African RepublicCentral Europe and the BalticsChadChileChinaColombiaComorosCongo, Dem. Rep.Congo, Rep.Costa RicaCote d'IvoireCroatiaCubaCyprusCzech RepublicDenmarkDjiboutiDominicaDominican RepublicEarly-demographic dividendEast Asia & PacificEast Asia & Pacific (excluding high income)East Asia & Pacific (IDA & IBRD countries)EcuadorEgypt, Arab Rep.El SalvadorEquatorial GuineaEritreaEstoniaEthiopiaEuro areaEurope & Central AsiaEurope & Central Asia (excluding high income)Europe & Central Asia (IDA & IBRD countries)European UnionFaroe IslandsFijiFinlandFragile and conflict affected situationsFranceGabonGambia, TheGeorgiaGermanyGhanaGreeceGrenadaGuatemalaGuineaGuinea-BissauGuyanaHaitiHeavily indebted poor countries (HIPC)High incomeHondurasHong Kong SAR, ChinaHungaryIBRD onlyIcelandIDA & IBRD totalIDA blendIDA onlyIDA totalIndiaIndonesiaIran, Islamic Rep.IraqIrelandIsraelItalyJamaicaJapanJordanKazakhstanKenyaKiribatiKorea, Rep.KosovoKuwaitKyrgyz RepublicLao PDRLate-demographic dividendLatin America & Caribbean Latin America & Caribbean (excluding high income)Latin America & the Caribbean (IDA & IBRD countries)LatviaLeast developed countries: UN classificationLebanonLesothoLiberiaLibyaLithuaniaLow & middle incomeLow incomeLower middle incomeLuxembourgMacao SAR, ChinaMacedonia, FYRMadagascarMalawiMalaysiaMaldivesMaliMaltaMauritaniaMauritiusMexicoMicronesia, Fed. Sts.Middle East & North AfricaMiddle East & North Africa (excluding high income)Middle East & North Africa (IDA & IBRD countries)Middle incomeMoldovaMongoliaMontenegroMoroccoMozambiqueNamibiaNepalNetherlandsNew CaledoniaNew ZealandNicaraguaNigerNigeriaNorth AmericaNorwayOECD membersOmanOther small statesPacific island small statesPakistanPanamaPapua New GuineaParaguayPeruPhilippinesPolandPortugalPost-demographic dividendPre-demographic dividendPuerto RicoQatarRomaniaRussian FederationRwandaSaudi ArabiaSenegalSerbiaSeychellesSierra LeoneSingaporeSlovak RepublicSloveniaSmall statesSolomon IslandsSomaliaSouth AfricaSouth AsiaSouth Asia (IDA & IBRD)South SudanSpainSri LankaSt. Kitts and NevisSt. LuciaSt. Vincent and the GrenadinesSub-Saharan Africa Sub-Saharan Africa (excluding high income)Sub-Saharan Africa (IDA & IBRD countries)SudanSurinameSwazilandSwedenSwitzerlandSyrian Arab RepublicTajikistanTanzaniaThailandTimor-LesteTogoTongaTrinidad and TobagoTunisiaTurkeyTurkmenistanUgandaUkraineUnited Arab EmiratesUnited KingdomUnited StatesUpper middle incomeUruguayUzbekistanVanuatuVenezuela, RBVietnamWest Bank and GazaWorldYemen, Rep.ZambiaZimbabwe Timeline:
This timeline shows a graph from 1961 to 2016 of Ghana. No data until 1960. Number of actual observations by date: 56.
Source name:
World Development Indicators
Source organization:
World Bank national accounts data, and OECD National Accounts data files.
Categories, topics:
Economy & Growth
Last updated:
apr 23, 2017
Indicators value changes by year
Minimum:
59.777
jan 1, 2013
Maximum:
90.822
jan 1, 1984
At the date of observation
Value
Absolute change
Change from previous value
jan 1, 1961
72.842
+72.842
0.0%
jan 1, 1962
79.355
+6.512
8.94%
jan 1, 1963
76.798
-2.556
-3.22%
jan 1, 1964
76.182
-0.617
-0.8%
jan 1, 1965
72.735
-3.447
-4.52%
jan 1, 1966
77.285
+4.551
6.26%
jan 1, 1967
79.117
+1.832
2.37%
jan 1, 1968
77.261
-1.857
-2.35%
jan 1, 1969
72.588
-4.672
-6.05%
jan 1, 1970
74.563
+1.974
2.72%
jan 1, 1971
74.369
-0.194
-0.26%
jan 1, 1972
77.4
+3.031
4.08%
jan 1, 1973
74.778
-2.622
-3.39%
jan 1, 1974
75.007
+0.229
0.31%
jan 1, 1975
78.219
+3.212
4.28%
jan 1, 1976
73.33
-4.889
-6.25%
jan 1, 1977
79.206
+5.877
8.01%
jan 1, 1978
77.363
-1.844
-2.33%
jan 1, 1979
84.656
+7.294
9.43%
jan 1, 1980
83.105
-1.551
-1.83%
jan 1, 1981
83.9
+0.795
0.96%
jan 1, 1982
87.204
+3.304
3.94%
jan 1, 1983
89.785
+2.581
2.96%
jan 1, 1984
90.822
+1.037
1.16%
jan 1, 1985
88.59
-2.232
-2.46%
jan 1, 1986
83.966
-4.624
-5.22%
jan 1, 1987
83.13
-0.836
-1.0%
jan 1, 1988
85.455
+2.324
2.8%
jan 1, 1989
84.875
-0.58
-0.68%
jan 1, 1990
84.547
-0.328
-0.39%
jan 1, 1991
85.217
+0.67
0.79%
jan 1, 1992
83.199
-2.018
-2.37%
jan 1, 1993
86.634
+3.435
4.13%
jan 1, 1994
79.502
-7.132
-8.23%
jan 1, 1995
73.823
-5.679
-7.14%
jan 1, 1996
76.335
+2.513
3.4%
jan 1, 1997
74.737
-1.598
-2.09%
jan 1, 1998
83.419
+8.683
11.62%
jan 1, 1999
79.423
-3.996
-4.79%
jan 1, 2000
85.705
+6.281
7.91%
jan 1, 2001
84.274
-1.431
-1.67%
jan 1, 2002
83.258
-1.016
-1.21%
jan 1, 2003
82.684
-0.574
-0.69%
jan 1, 2004
81.459
-1.225
-1.48%
jan 1, 2005
80.513
-0.946
-1.16%
jan 1, 2006
80.963
+0.449
0.56%
jan 1, 2007
82.598
+1.635
2.02%
jan 1, 2008
84.637
+2.039
2.47%
jan 1, 2009
86.761
+2.123
2.51%
jan 1, 2010
80.606
-6.154
-7.09%
jan 1, 2011
80.073
-0.533
-0.66%
jan 1, 2012
69.339
-10.734
-13.41%
jan 1, 2013
59.777
-9.562
-13.79%
jan 1, 2014
65.624
+5.847
9.78%
jan 1, 2015
64.29
-1.334
-2.03%
jan 1, 2016
67.76
+3.471
5.4%
Ranking of countries by current statistics by years


Comments: