29
/
en
AIzaSyAYiBZKx7MnpbEhh9jyipgxe19OcubqV5w
April 1, 2024
78346
Bangladesh
BGD
true
2
1
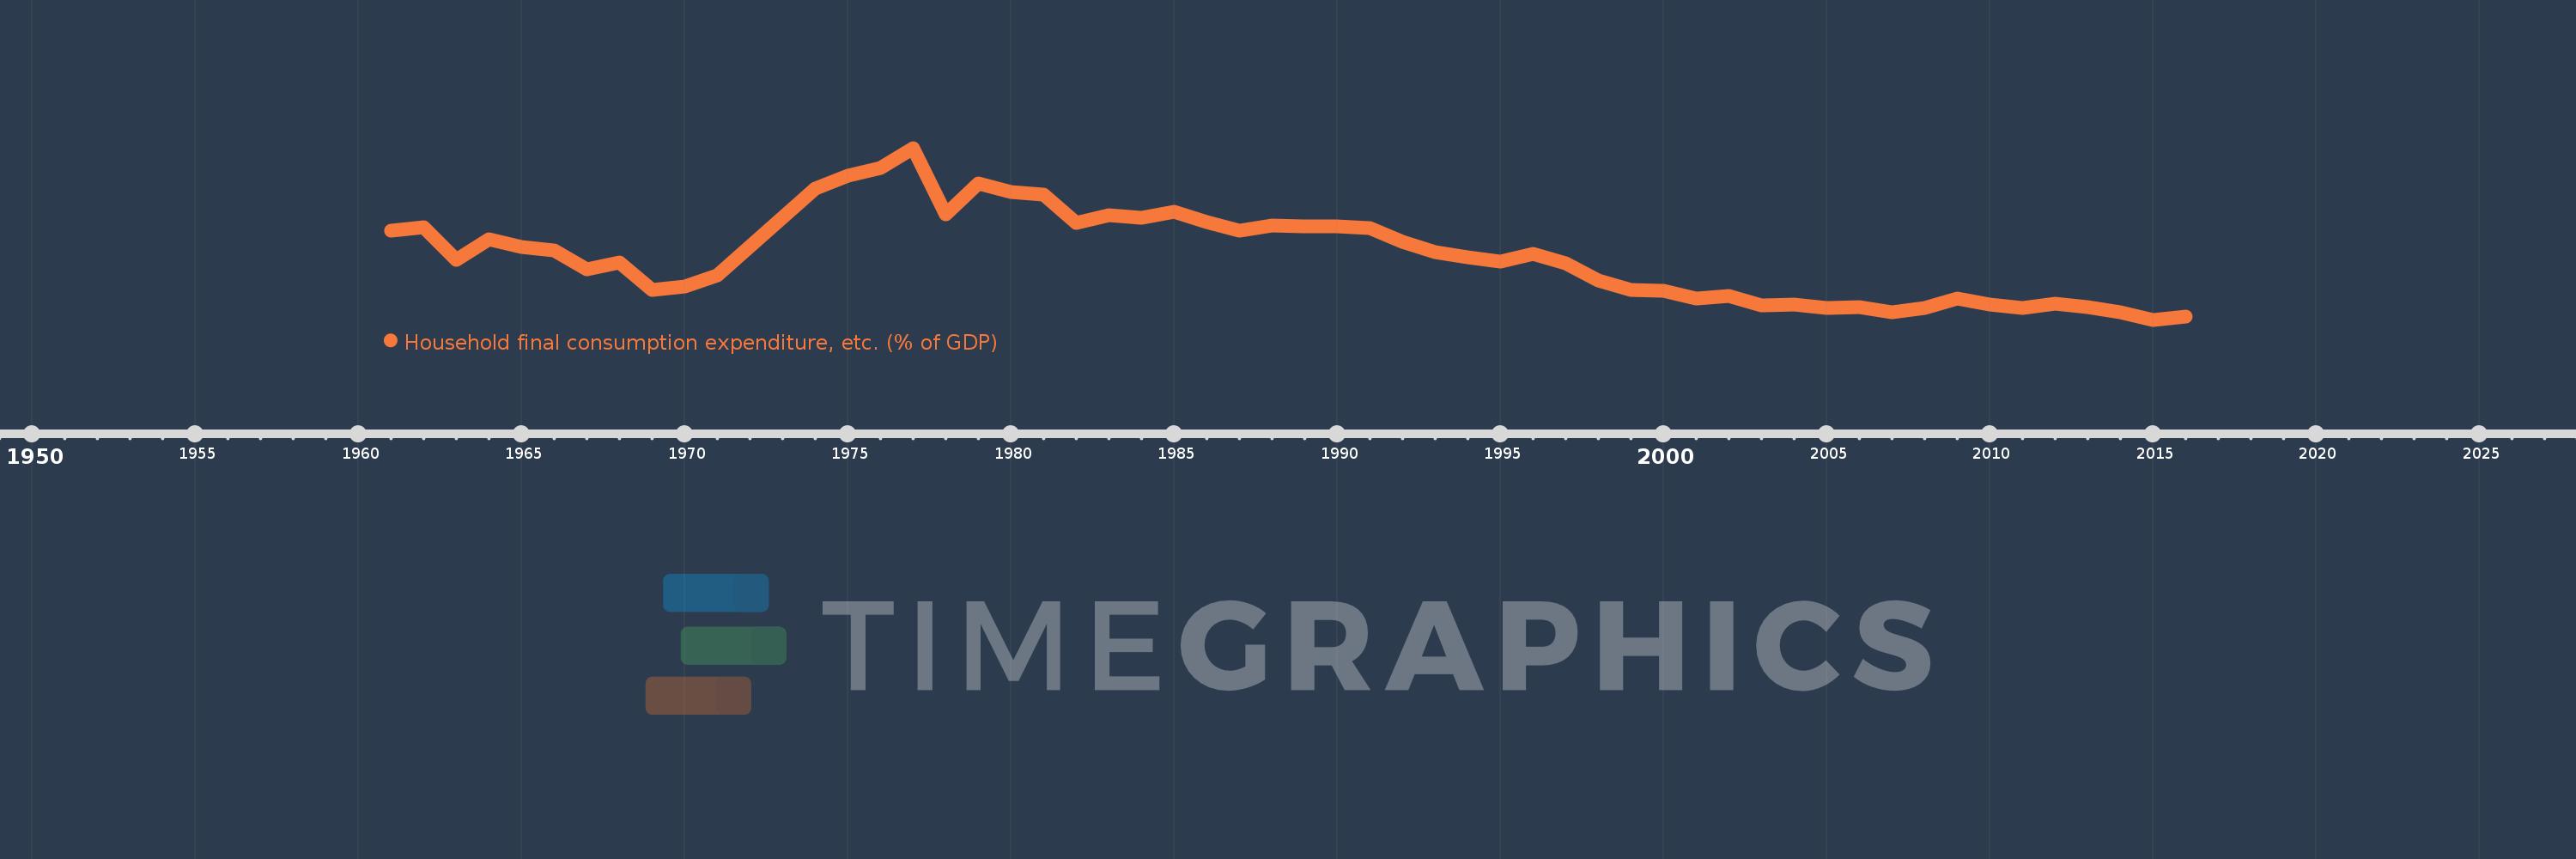
Household final consumption expenditure, etc. (% of GDP)
2016,2015,2014,2013,2012,2011,2010,2009,2008,2007,2006,2005,2004,2003,2002,2001,2000,1999,1998,1997,1996,1995,1994,1993,1992,1991,1990,1989,1988,1987,1986,1985,1984,1983,1982,1981,1980,1979,1978,1977,1976,1975,1974,1971,1970,1969,1968,1967,1966,1965,1964,1963,1962,1961
This statistics in other country:
AfghanistanAlbaniaAlgeriaAngolaAntigua and BarbudaArab WorldArgentinaArmeniaArubaAustraliaAustriaAzerbaijanBahamas, TheBahrainBangladeshBarbadosBelarusBelgiumBelizeBeninBermudaBhutanBoliviaBosnia and HerzegovinaBotswanaBrazilBrunei DarussalamBulgariaBurkina FasoBurundiCabo VerdeCambodiaCameroonCanadaCaribbean small statesCentral African RepublicCentral Europe and the BalticsChadChileChinaColombiaComorosCongo, Dem. Rep.Congo, Rep.Costa RicaCote d'IvoireCroatiaCubaCyprusCzech RepublicDenmarkDjiboutiDominicaDominican RepublicEarly-demographic dividendEast Asia & PacificEast Asia & Pacific (excluding high income)East Asia & Pacific (IDA & IBRD countries)EcuadorEgypt, Arab Rep.El SalvadorEquatorial GuineaEritreaEstoniaEthiopiaEuro areaEurope & Central AsiaEurope & Central Asia (excluding high income)Europe & Central Asia (IDA & IBRD countries)European UnionFaroe IslandsFijiFinlandFragile and conflict affected situationsFranceGabonGambia, TheGeorgiaGermanyGhanaGreeceGrenadaGuatemalaGuineaGuinea-BissauGuyanaHaitiHeavily indebted poor countries (HIPC)High incomeHondurasHong Kong SAR, ChinaHungaryIBRD onlyIcelandIDA & IBRD totalIDA blendIDA onlyIDA totalIndiaIndonesiaIran, Islamic Rep.IraqIrelandIsraelItalyJamaicaJapanJordanKazakhstanKenyaKiribatiKorea, Rep.KosovoKuwaitKyrgyz RepublicLao PDRLate-demographic dividendLatin America & Caribbean Latin America & Caribbean (excluding high income)Latin America & the Caribbean (IDA & IBRD countries)LatviaLeast developed countries: UN classificationLebanonLesothoLiberiaLibyaLithuaniaLow & middle incomeLow incomeLower middle incomeLuxembourgMacao SAR, ChinaMacedonia, FYRMadagascarMalawiMalaysiaMaldivesMaliMaltaMauritaniaMauritiusMexicoMicronesia, Fed. Sts.Middle East & North AfricaMiddle East & North Africa (excluding high income)Middle East & North Africa (IDA & IBRD countries)Middle incomeMoldovaMongoliaMontenegroMoroccoMozambiqueNamibiaNepalNetherlandsNew CaledoniaNew ZealandNicaraguaNigerNigeriaNorth AmericaNorwayOECD membersOmanOther small statesPacific island small statesPakistanPanamaPapua New GuineaParaguayPeruPhilippinesPolandPortugalPost-demographic dividendPre-demographic dividendPuerto RicoQatarRomaniaRussian FederationRwandaSaudi ArabiaSenegalSerbiaSeychellesSierra LeoneSingaporeSlovak RepublicSloveniaSmall statesSolomon IslandsSomaliaSouth AfricaSouth AsiaSouth Asia (IDA & IBRD)South SudanSpainSri LankaSt. Kitts and NevisSt. LuciaSt. Vincent and the GrenadinesSub-Saharan Africa Sub-Saharan Africa (excluding high income)Sub-Saharan Africa (IDA & IBRD countries)SudanSurinameSwazilandSwedenSwitzerlandSyrian Arab RepublicTajikistanTanzaniaThailandTimor-LesteTogoTongaTrinidad and TobagoTunisiaTurkeyTurkmenistanUgandaUkraineUnited Arab EmiratesUnited KingdomUnited StatesUpper middle incomeUruguayUzbekistanVanuatuVenezuela, RBVietnamWest Bank and GazaWorldYemen, Rep.ZambiaZimbabwe Timeline:
This timeline shows a graph from 1961 to 2016 of Bangladesh. No data until 1960. Number of actual observations by date: 54.
Source name:
World Development Indicators
Source organization:
World Bank national accounts data, and OECD National Accounts data files.
Categories, topics:
Economy & Growth
Last updated:
apr 23, 2017
Indicators value changes by year
Minimum:
72.619
jan 1, 2015
Maximum:
98.911
jan 1, 1977
At the date of observation
Value
Absolute change
Change from previous value
jan 1, 1961
86.225
+86.225
0.0%
jan 1, 1962
86.835
+0.611
0.71%
jan 1, 1963
81.758
-5.077
-5.85%
jan 1, 1964
84.876
+3.118
3.81%
jan 1, 1965
83.758
-1.118
-1.32%
jan 1, 1966
83.169
-0.588
-0.7%
jan 1, 1967
80.4
-2.77
-3.33%
jan 1, 1968
81.376
+0.976
1.21%
jan 1, 1969
77.143
-4.233
-5.2%
jan 1, 1970
77.757
+0.613
0.8%
jan 1, 1971
79.472
+1.716
2.21%
jan 1, 1974
92.665
+13.193
16.6%
jan 1, 1975
94.63
+1.965
2.12%
jan 1, 1976
95.894
+1.264
1.34%
jan 1, 1977
98.911
+3.017
3.15%
jan 1, 1978
88.728
-10.183
-10.29%
jan 1, 1979
93.501
+4.773
5.38%
jan 1, 1980
92.201
-1.3
-1.39%
jan 1, 1981
91.808
-0.393
-0.43%
jan 1, 1982
87.438
-4.37
-4.76%
jan 1, 1983
88.661
+1.222
1.4%
jan 1, 1984
88.237
-0.423
-0.48%
jan 1, 1985
89.19
+0.953
1.08%
jan 1, 1986
87.592
-1.599
-1.79%
jan 1, 1987
86.275
-1.316
-1.5%
jan 1, 1988
87.091
+0.816
0.95%
jan 1, 1989
86.92
-0.171
-0.2%
jan 1, 1990
86.97
+0.05
0.06%
jan 1, 1991
86.638
-0.332
-0.38%
jan 1, 1992
84.532
-2.106
-2.43%
jan 1, 1993
83.004
-1.528
-1.81%
jan 1, 1994
82.186
-0.818
-0.99%
jan 1, 1995
81.577
-0.609
-0.74%
jan 1, 1996
82.731
+1.153
1.41%
jan 1, 1997
81.206
-1.525
-1.84%
jan 1, 1998
78.566
-2.64
-3.25%
jan 1, 1999
77.118
-1.447
-1.84%
jan 1, 2000
77.11
-0.009
-0.01%
jan 1, 2001
75.852
-1.258
-1.63%
jan 1, 2002
76.305
+0.453
0.6%
jan 1, 2003
74.783
-1.522
-1.99%
jan 1, 2004
74.988
+0.205
0.27%
jan 1, 2005
74.399
-0.589
-0.79%
jan 1, 2006
74.601
+0.202
0.27%
jan 1, 2007
73.821
-0.78
-1.05%
jan 1, 2008
74.414
+0.593
0.8%
jan 1, 2009
75.923
+1.509
2.03%
jan 1, 2010
74.913
-1.01
-1.33%
jan 1, 2011
74.433
-0.48
-0.64%
jan 1, 2012
75.058
+0.626
0.84%
jan 1, 2013
74.486
-0.572
-0.76%
jan 1, 2014
73.715
-0.771
-1.04%
jan 1, 2015
72.619
-1.096
-1.49%
jan 1, 2016
73.122
+0.502
0.69%
Ranking of countries by current statistics by years


Comments: