29
/
en
AIzaSyAYiBZKx7MnpbEhh9jyipgxe19OcubqV5w
April 1, 2024
126280
El Salvador
SLV
true
2
1
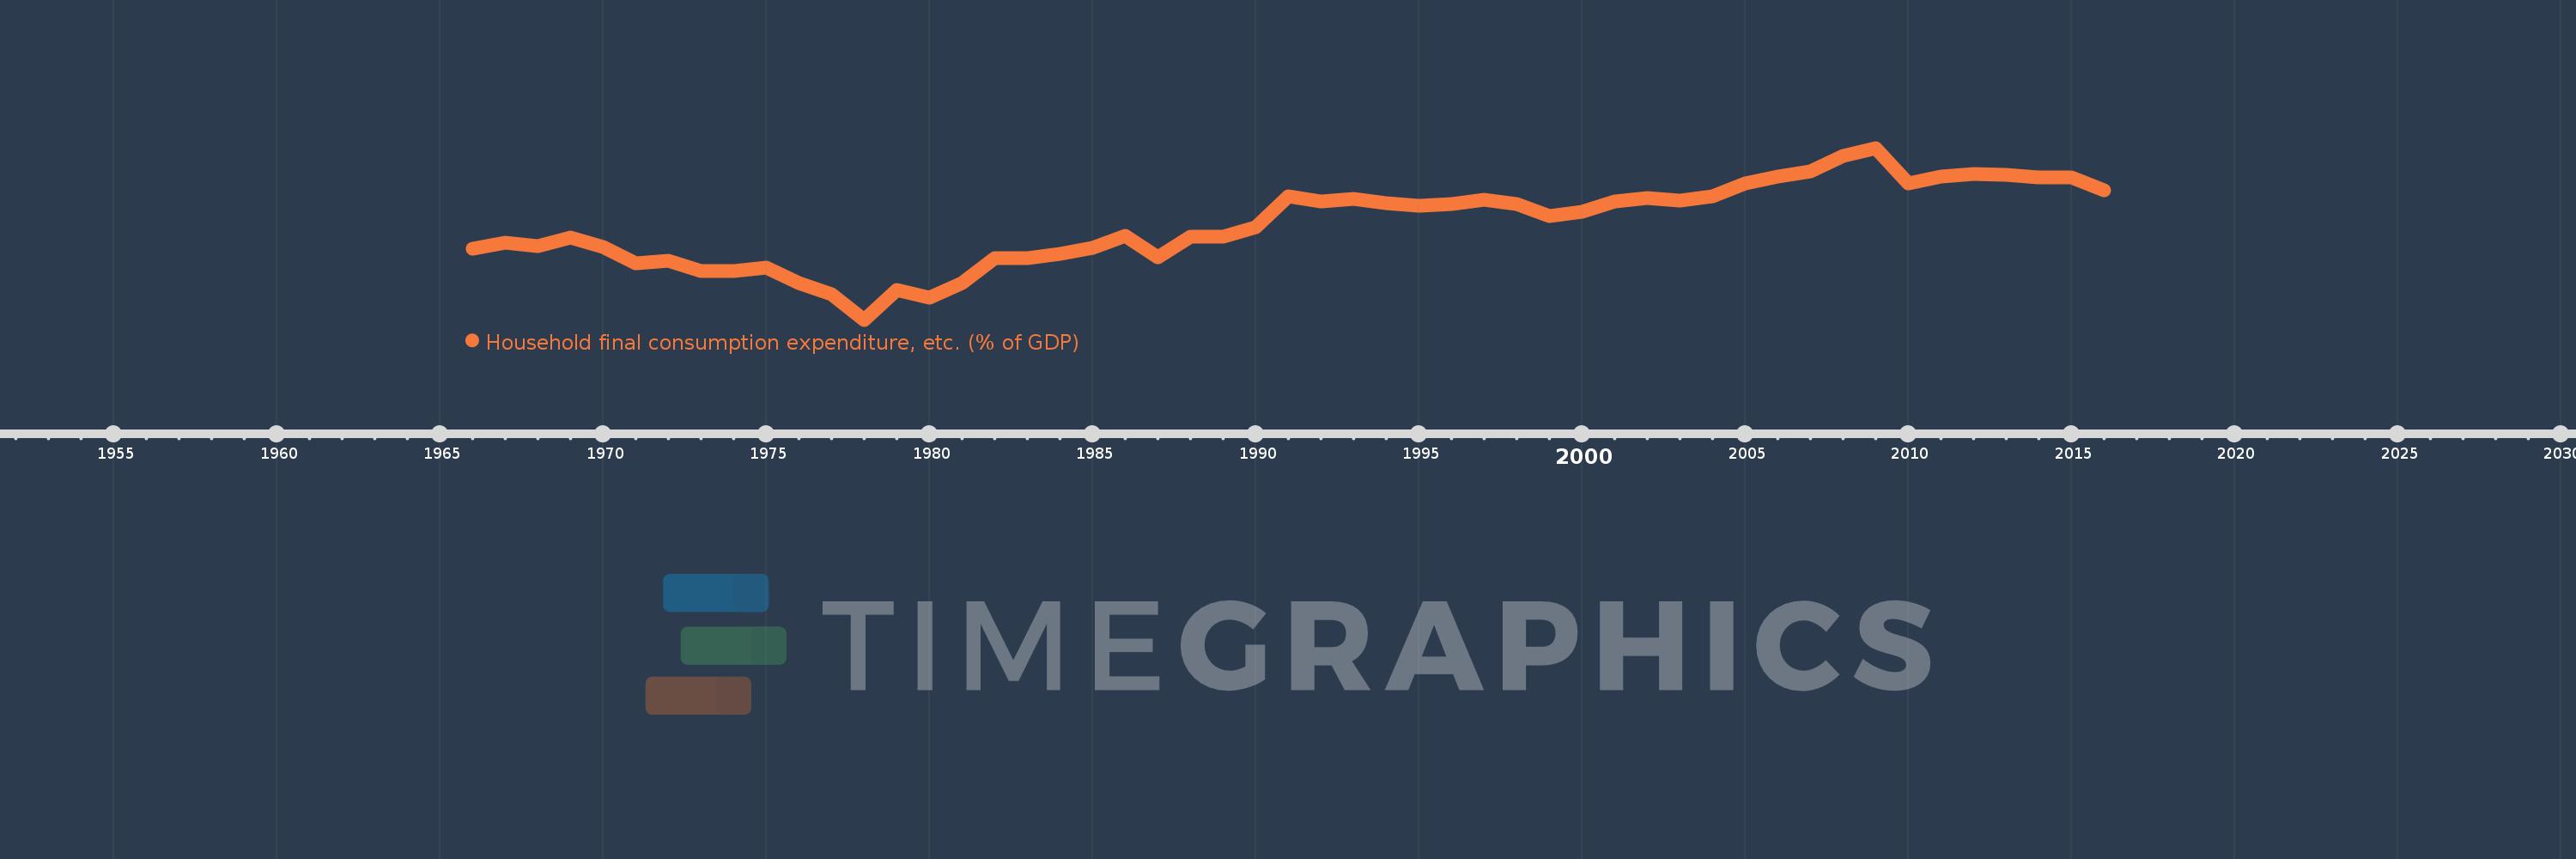
Household final consumption expenditure, etc. (% of GDP)
2016,2015,2014,2013,2012,2011,2010,2009,2008,2007,2006,2005,2004,2003,2002,2001,2000,1999,1998,1997,1996,1995,1994,1993,1992,1991,1990,1989,1988,1987,1986,1985,1984,1983,1982,1981,1980,1979,1978,1977,1976,1975,1974,1973,1972,1971,1970,1969,1968,1967,1966
This statistics in other country:
AfghanistanAlbaniaAlgeriaAngolaAntigua and BarbudaArab WorldArgentinaArmeniaArubaAustraliaAustriaAzerbaijanBahamas, TheBahrainBangladeshBarbadosBelarusBelgiumBelizeBeninBermudaBhutanBoliviaBosnia and HerzegovinaBotswanaBrazilBrunei DarussalamBulgariaBurkina FasoBurundiCabo VerdeCambodiaCameroonCanadaCaribbean small statesCentral African RepublicCentral Europe and the BalticsChadChileChinaColombiaComorosCongo, Dem. Rep.Congo, Rep.Costa RicaCote d'IvoireCroatiaCubaCyprusCzech RepublicDenmarkDjiboutiDominicaDominican RepublicEarly-demographic dividendEast Asia & PacificEast Asia & Pacific (excluding high income)East Asia & Pacific (IDA & IBRD countries)EcuadorEgypt, Arab Rep.El SalvadorEquatorial GuineaEritreaEstoniaEthiopiaEuro areaEurope & Central AsiaEurope & Central Asia (excluding high income)Europe & Central Asia (IDA & IBRD countries)European UnionFaroe IslandsFijiFinlandFragile and conflict affected situationsFranceGabonGambia, TheGeorgiaGermanyGhanaGreeceGrenadaGuatemalaGuineaGuinea-BissauGuyanaHaitiHeavily indebted poor countries (HIPC)High incomeHondurasHong Kong SAR, ChinaHungaryIBRD onlyIcelandIDA & IBRD totalIDA blendIDA onlyIDA totalIndiaIndonesiaIran, Islamic Rep.IraqIrelandIsraelItalyJamaicaJapanJordanKazakhstanKenyaKiribatiKorea, Rep.KosovoKuwaitKyrgyz RepublicLao PDRLate-demographic dividendLatin America & Caribbean Latin America & Caribbean (excluding high income)Latin America & the Caribbean (IDA & IBRD countries)LatviaLeast developed countries: UN classificationLebanonLesothoLiberiaLibyaLithuaniaLow & middle incomeLow incomeLower middle incomeLuxembourgMacao SAR, ChinaMacedonia, FYRMadagascarMalawiMalaysiaMaldivesMaliMaltaMauritaniaMauritiusMexicoMicronesia, Fed. Sts.Middle East & North AfricaMiddle East & North Africa (excluding high income)Middle East & North Africa (IDA & IBRD countries)Middle incomeMoldovaMongoliaMontenegroMoroccoMozambiqueNamibiaNepalNetherlandsNew CaledoniaNew ZealandNicaraguaNigerNigeriaNorth AmericaNorwayOECD membersOmanOther small statesPacific island small statesPakistanPanamaPapua New GuineaParaguayPeruPhilippinesPolandPortugalPost-demographic dividendPre-demographic dividendPuerto RicoQatarRomaniaRussian FederationRwandaSaudi ArabiaSenegalSerbiaSeychellesSierra LeoneSingaporeSlovak RepublicSloveniaSmall statesSolomon IslandsSomaliaSouth AfricaSouth AsiaSouth Asia (IDA & IBRD)South SudanSpainSri LankaSt. Kitts and NevisSt. LuciaSt. Vincent and the GrenadinesSub-Saharan Africa Sub-Saharan Africa (excluding high income)Sub-Saharan Africa (IDA & IBRD countries)SudanSurinameSwazilandSwedenSwitzerlandSyrian Arab RepublicTajikistanTanzaniaThailandTimor-LesteTogoTongaTrinidad and TobagoTunisiaTurkeyTurkmenistanUgandaUkraineUnited Arab EmiratesUnited KingdomUnited StatesUpper middle incomeUruguayUzbekistanVanuatuVenezuela, RBVietnamWest Bank and GazaWorldYemen, Rep.ZambiaZimbabwe Timeline:
This timeline shows a graph from 1966 to 2016 of El Salvador. No data until 1965. Number of actual observations by date: 51.
Source name:
World Development Indicators
Source organization:
World Bank national accounts data, and OECD National Accounts data files.
Categories, topics:
Economy & Growth
Last updated:
apr 23, 2017
Indicators value changes by year
Minimum:
64.663
jan 1, 1978
Maximum:
98.441
jan 1, 2009
At the date of observation
Value
Absolute change
Change from previous value
jan 1, 1966
78.581
+78.581
0.0%
jan 1, 1967
79.826
+1.245
1.58%
jan 1, 1968
79.099
-0.728
-0.91%
jan 1, 1969
80.799
+1.701
2.15%
jan 1, 1970
79.047
-1.752
-2.17%
jan 1, 1971
75.744
-3.303
-4.18%
jan 1, 1972
76.222
+0.478
0.63%
jan 1, 1973
74.197
-2.025
-2.66%
jan 1, 1974
74.269
+0.072
0.1%
jan 1, 1975
74.915
+0.646
0.87%
jan 1, 1976
71.855
-3.06
-4.08%
jan 1, 1977
69.633
-2.223
-3.09%
jan 1, 1978
64.663
-4.969
-7.14%
jan 1, 1979
70.592
+5.928
9.17%
jan 1, 1980
68.922
-1.67
-2.37%
jan 1, 1981
71.821
+2.899
4.21%
jan 1, 1982
76.836
+5.015
6.98%
jan 1, 1983
76.693
-0.143
-0.19%
jan 1, 1984
77.536
+0.843
1.1%
jan 1, 1985
78.786
+1.25
1.61%
jan 1, 1986
81.227
+2.441
3.1%
jan 1, 1987
76.946
-4.281
-5.27%
jan 1, 1988
81.003
+4.057
5.27%
jan 1, 1989
80.951
-0.052
-0.06%
jan 1, 1990
82.931
+1.98
2.45%
jan 1, 1991
88.896
+5.965
7.19%
jan 1, 1992
87.953
-0.943
-1.06%
jan 1, 1993
88.446
+0.493
0.56%
jan 1, 1994
87.563
-0.883
-1.0%
jan 1, 1995
87.15
-0.413
-0.47%
jan 1, 1996
87.434
+0.284
0.33%
jan 1, 1997
88.32
+0.886
1.01%
jan 1, 1998
87.467
-0.853
-0.97%
jan 1, 1999
84.991
-2.476
-2.83%
jan 1, 2000
85.899
+0.907
1.07%
jan 1, 2001
87.935
+2.037
2.37%
jan 1, 2002
88.644
+0.709
0.81%
jan 1, 2003
88.004
-0.64
-0.72%
jan 1, 2004
88.997
+0.993
1.13%
jan 1, 2005
91.486
+2.489
2.8%
jan 1, 2006
92.844
+1.358
1.48%
jan 1, 2007
93.829
+0.985
1.06%
jan 1, 2008
96.819
+2.99
3.19%
jan 1, 2009
98.441
+1.622
1.68%
jan 1, 2010
91.415
-7.026
-7.14%
jan 1, 2011
92.897
+1.482
1.62%
jan 1, 2012
93.265
+0.369
0.4%
jan 1, 2013
93.083
-0.182
-0.2%
jan 1, 2014
92.682
-0.401
-0.43%
jan 1, 2015
92.679
-0.003
0.0%
jan 1, 2016
90.195
-2.484
-2.68%
Ranking of countries by current statistics by years


Comments: