29
/
en
AIzaSyAYiBZKx7MnpbEhh9jyipgxe19OcubqV5w
April 1, 2024
148032
Guyana
GUY
true
2
1
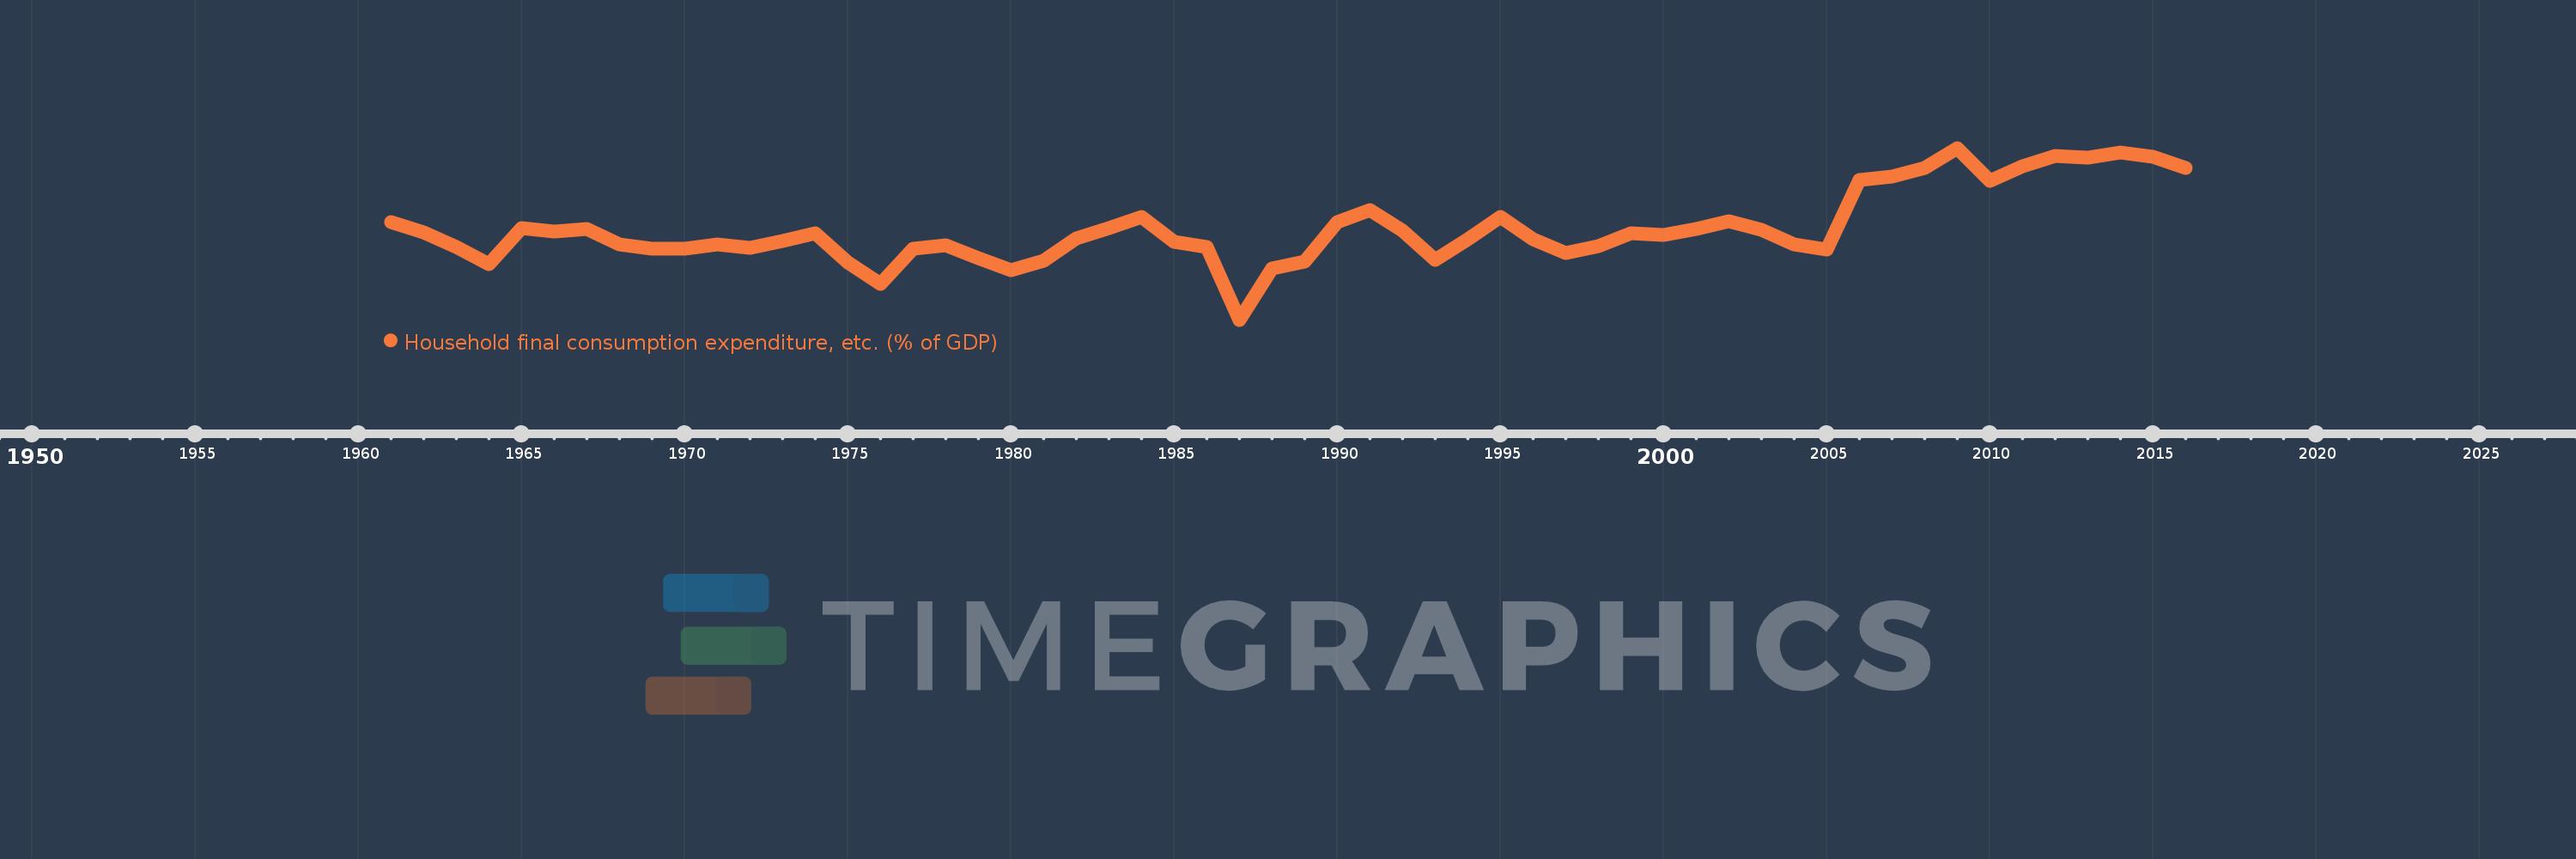
Household final consumption expenditure, etc. (% of GDP)
2016,2015,2014,2013,2012,2011,2010,2009,2008,2007,2006,2005,2004,2003,2002,2001,2000,1999,1998,1997,1996,1995,1994,1993,1992,1991,1990,1989,1988,1987,1986,1985,1984,1983,1982,1981,1980,1979,1978,1977,1976,1975,1974,1973,1972,1971,1970,1969,1968,1967,1966,1965,1964,1963,1962,1961
This statistics in other country:
AfghanistanAlbaniaAlgeriaAngolaAntigua and BarbudaArab WorldArgentinaArmeniaArubaAustraliaAustriaAzerbaijanBahamas, TheBahrainBangladeshBarbadosBelarusBelgiumBelizeBeninBermudaBhutanBoliviaBosnia and HerzegovinaBotswanaBrazilBrunei DarussalamBulgariaBurkina FasoBurundiCabo VerdeCambodiaCameroonCanadaCaribbean small statesCentral African RepublicCentral Europe and the BalticsChadChileChinaColombiaComorosCongo, Dem. Rep.Congo, Rep.Costa RicaCote d'IvoireCroatiaCubaCyprusCzech RepublicDenmarkDjiboutiDominicaDominican RepublicEarly-demographic dividendEast Asia & PacificEast Asia & Pacific (excluding high income)East Asia & Pacific (IDA & IBRD countries)EcuadorEgypt, Arab Rep.El SalvadorEquatorial GuineaEritreaEstoniaEthiopiaEuro areaEurope & Central AsiaEurope & Central Asia (excluding high income)Europe & Central Asia (IDA & IBRD countries)European UnionFaroe IslandsFijiFinlandFragile and conflict affected situationsFranceGabonGambia, TheGeorgiaGermanyGhanaGreeceGrenadaGuatemalaGuineaGuinea-BissauGuyanaHaitiHeavily indebted poor countries (HIPC)High incomeHondurasHong Kong SAR, ChinaHungaryIBRD onlyIcelandIDA & IBRD totalIDA blendIDA onlyIDA totalIndiaIndonesiaIran, Islamic Rep.IraqIrelandIsraelItalyJamaicaJapanJordanKazakhstanKenyaKiribatiKorea, Rep.KosovoKuwaitKyrgyz RepublicLao PDRLate-demographic dividendLatin America & Caribbean Latin America & Caribbean (excluding high income)Latin America & the Caribbean (IDA & IBRD countries)LatviaLeast developed countries: UN classificationLebanonLesothoLiberiaLibyaLithuaniaLow & middle incomeLow incomeLower middle incomeLuxembourgMacao SAR, ChinaMacedonia, FYRMadagascarMalawiMalaysiaMaldivesMaliMaltaMauritaniaMauritiusMexicoMicronesia, Fed. Sts.Middle East & North AfricaMiddle East & North Africa (excluding high income)Middle East & North Africa (IDA & IBRD countries)Middle incomeMoldovaMongoliaMontenegroMoroccoMozambiqueNamibiaNepalNetherlandsNew CaledoniaNew ZealandNicaraguaNigerNigeriaNorth AmericaNorwayOECD membersOmanOther small statesPacific island small statesPakistanPanamaPapua New GuineaParaguayPeruPhilippinesPolandPortugalPost-demographic dividendPre-demographic dividendPuerto RicoQatarRomaniaRussian FederationRwandaSaudi ArabiaSenegalSerbiaSeychellesSierra LeoneSingaporeSlovak RepublicSloveniaSmall statesSolomon IslandsSomaliaSouth AfricaSouth AsiaSouth Asia (IDA & IBRD)South SudanSpainSri LankaSt. Kitts and NevisSt. LuciaSt. Vincent and the GrenadinesSub-Saharan Africa Sub-Saharan Africa (excluding high income)Sub-Saharan Africa (IDA & IBRD countries)SudanSurinameSwazilandSwedenSwitzerlandSyrian Arab RepublicTajikistanTanzaniaThailandTimor-LesteTogoTongaTrinidad and TobagoTunisiaTurkeyTurkmenistanUgandaUkraineUnited Arab EmiratesUnited KingdomUnited StatesUpper middle incomeUruguayUzbekistanVanuatuVenezuela, RBVietnamWest Bank and GazaWorldYemen, Rep.ZambiaZimbabwe Timeline:
This timeline shows a graph from 1961 to 2016 of Guyana. No data until 1960. Number of actual observations by date: 56.
Source name:
World Development Indicators
Source organization:
World Bank national accounts data, and OECD National Accounts data files.
Categories, topics:
Economy & Growth
Last updated:
apr 23, 2017
Indicators value changes by year
Minimum:
35.295
jan 1, 1987
At the date of observation
Value
Absolute change
Change from previous value
jan 1, 1961
68.506
+68.506
0.0%
jan 1, 1962
65.003
-3.503
-5.11%
jan 1, 1963
60.054
-4.949
-7.61%
jan 1, 1964
54.165
-5.889
-9.81%
jan 1, 1965
66.397
+12.232
22.58%
jan 1, 1966
65.159
-1.239
-1.87%
jan 1, 1967
66.101
+0.942
1.45%
jan 1, 1968
60.875
-5.226
-7.91%
jan 1, 1969
59.434
-1.441
-2.37%
jan 1, 1970
59.507
+0.072
0.12%
jan 1, 1971
60.81
+1.304
2.19%
jan 1, 1972
59.617
-1.193
-1.96%
jan 1, 1973
61.956
+2.339
3.92%
jan 1, 1974
64.718
+2.762
4.46%
jan 1, 1975
54.677
-10.041
-15.51%
jan 1, 1976
47.352
-7.325
-13.4%
jan 1, 1977
59.299
+11.948
25.23%
jan 1, 1978
60.701
+1.401
2.36%
jan 1, 1979
56.157
-4.544
-7.49%
jan 1, 1980
52.183
-3.974
-7.08%
jan 1, 1981
55.391
+3.208
6.15%
jan 1, 1982
62.962
+7.571
13.67%
jan 1, 1983
66.542
+3.58
5.69%
jan 1, 1984
70.198
+3.655
5.49%
jan 1, 1985
61.678
-8.52
-12.14%
jan 1, 1986
59.949
-1.729
-2.8%
jan 1, 1987
35.295
-24.654
-41.12%
jan 1, 1988
52.691
+17.396
49.29%
jan 1, 1989
55.051
+2.36
4.48%
jan 1, 1990
68.49
+13.439
24.41%
jan 1, 1991
72.403
+3.914
5.71%
jan 1, 1992
65.519
-6.884
-9.51%
jan 1, 1993
55.764
-9.755
-14.89%
jan 1, 1994
62.733
+6.97
12.5%
jan 1, 1995
70.264
+7.53
12.0%
jan 1, 1996
62.671
-7.592
-10.81%
jan 1, 1997
58.024
-4.647
-7.41%
jan 1, 1998
60.391
+2.367
4.08%
jan 1, 1999
64.619
+4.228
7.0%
jan 1, 2000
64.068
-0.551
-0.85%
jan 1, 2001
66.161
+2.092
3.27%
jan 1, 2002
68.71
+2.55
3.85%
jan 1, 2003
65.864
-2.846
-4.14%
jan 1, 2004
60.941
-4.922
-7.47%
jan 1, 2005
59.017
-1.924
-3.16%
jan 1, 2006
82.885
+23.868
40.44%
jan 1, 2007
83.765
+0.88
1.06%
jan 1, 2008
86.859
+3.094
3.69%
jan 1, 2009
93.62
+6.761
7.78%
jan 1, 2010
82.565
-11.055
-11.81%
jan 1, 2011
87.384
+4.819
5.84%
jan 1, 2012
90.789
+3.404
3.9%
jan 1, 2013
90.256
-0.533
-0.59%
jan 1, 2014
92.165
+1.909
2.12%
jan 1, 2015
90.748
-1.417
-1.54%
jan 1, 2016
86.961
-3.787
-4.17%
Ranking of countries by current statistics by years


Comments: