29
/
en
AIzaSyAYiBZKx7MnpbEhh9jyipgxe19OcubqV5w
April 1, 2024
100020
Cameroon
CMR
true
2
1
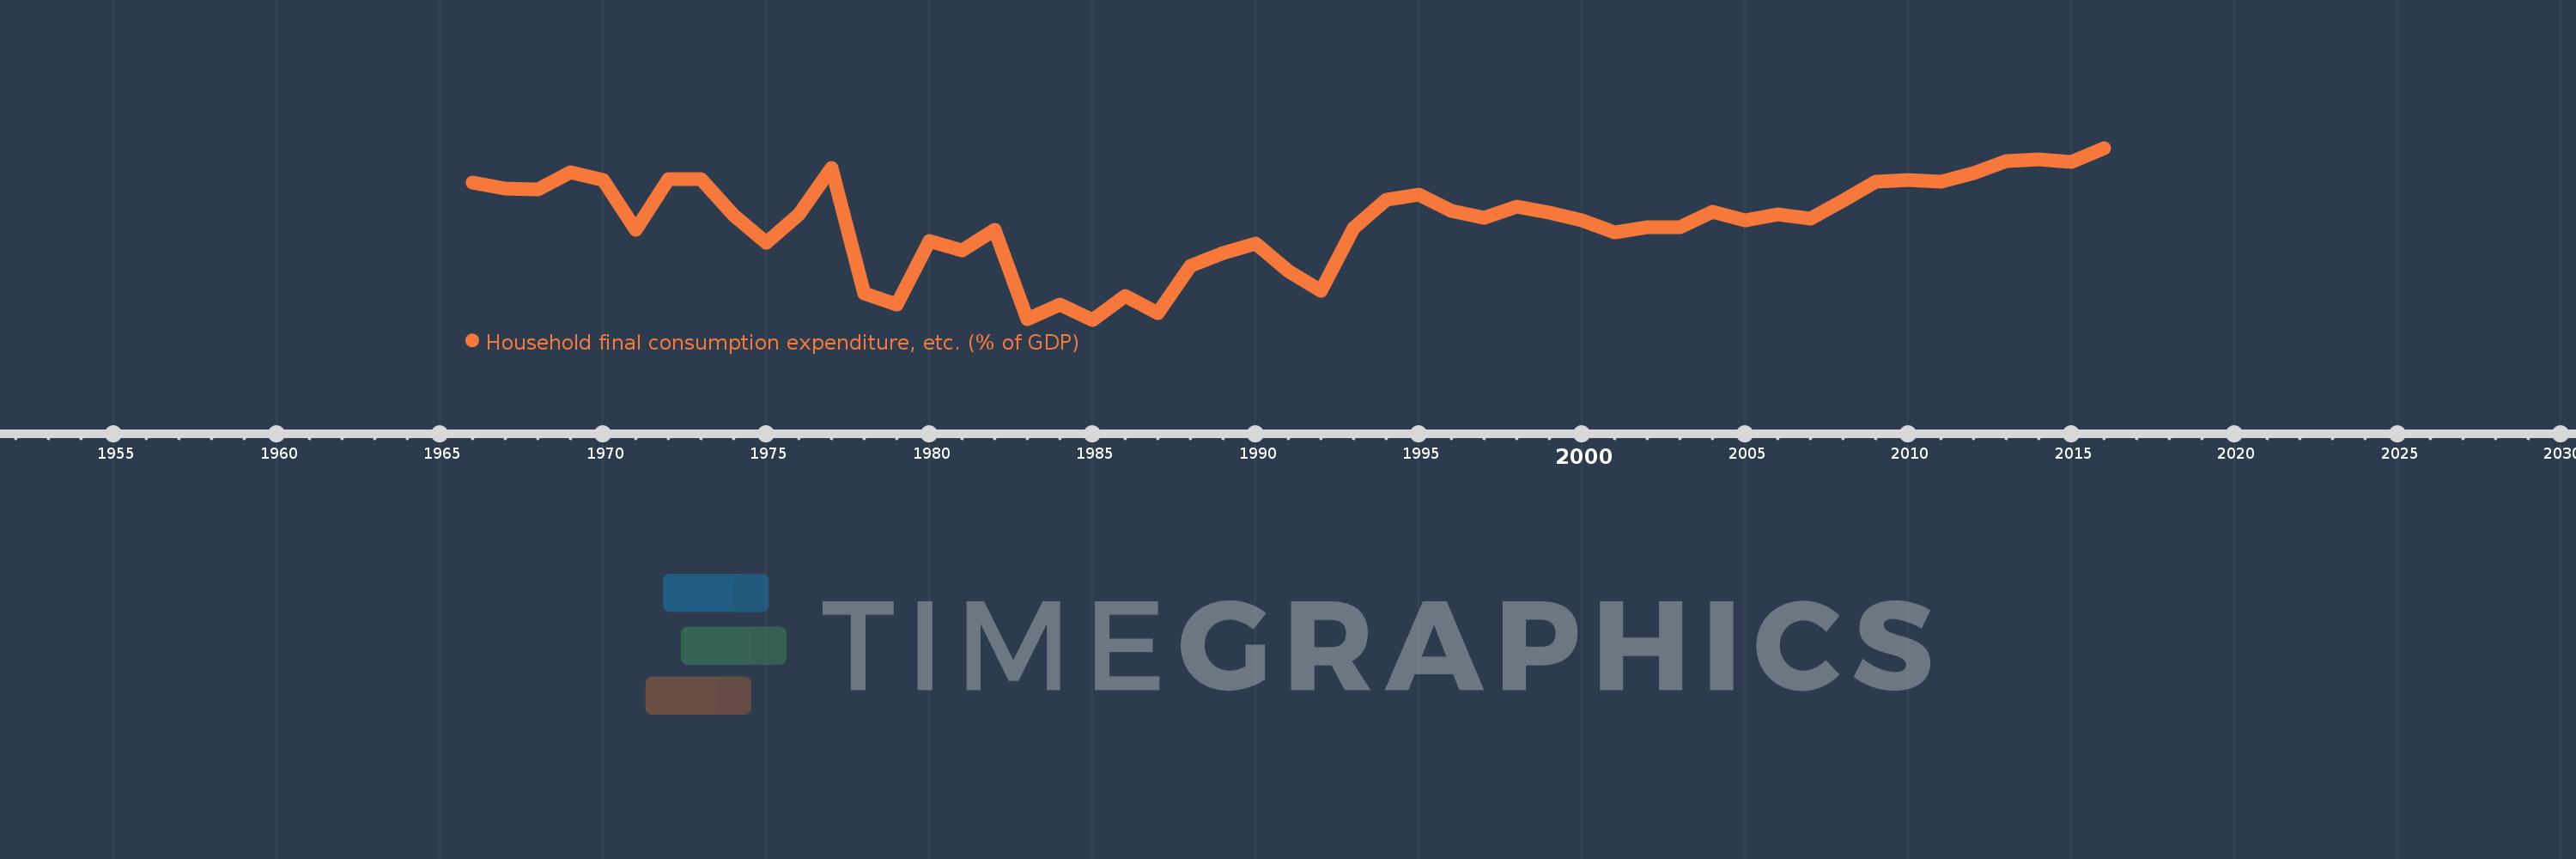
Household final consumption expenditure, etc. (% of GDP)
2016,2015,2014,2013,2012,2011,2010,2009,2008,2007,2006,2005,2004,2003,2002,2001,2000,1999,1998,1997,1996,1995,1994,1993,1992,1991,1990,1989,1988,1987,1986,1985,1984,1983,1982,1981,1980,1979,1978,1977,1976,1975,1974,1973,1972,1971,1970,1969,1968,1967,1966
This statistics in other country:
AfghanistanAlbaniaAlgeriaAngolaAntigua and BarbudaArab WorldArgentinaArmeniaArubaAustraliaAustriaAzerbaijanBahamas, TheBahrainBangladeshBarbadosBelarusBelgiumBelizeBeninBermudaBhutanBoliviaBosnia and HerzegovinaBotswanaBrazilBrunei DarussalamBulgariaBurkina FasoBurundiCabo VerdeCambodiaCameroonCanadaCaribbean small statesCentral African RepublicCentral Europe and the BalticsChadChileChinaColombiaComorosCongo, Dem. Rep.Congo, Rep.Costa RicaCote d'IvoireCroatiaCubaCyprusCzech RepublicDenmarkDjiboutiDominicaDominican RepublicEarly-demographic dividendEast Asia & PacificEast Asia & Pacific (excluding high income)East Asia & Pacific (IDA & IBRD countries)EcuadorEgypt, Arab Rep.El SalvadorEquatorial GuineaEritreaEstoniaEthiopiaEuro areaEurope & Central AsiaEurope & Central Asia (excluding high income)Europe & Central Asia (IDA & IBRD countries)European UnionFaroe IslandsFijiFinlandFragile and conflict affected situationsFranceGabonGambia, TheGeorgiaGermanyGhanaGreeceGrenadaGuatemalaGuineaGuinea-BissauGuyanaHaitiHeavily indebted poor countries (HIPC)High incomeHondurasHong Kong SAR, ChinaHungaryIBRD onlyIcelandIDA & IBRD totalIDA blendIDA onlyIDA totalIndiaIndonesiaIran, Islamic Rep.IraqIrelandIsraelItalyJamaicaJapanJordanKazakhstanKenyaKiribatiKorea, Rep.KosovoKuwaitKyrgyz RepublicLao PDRLate-demographic dividendLatin America & Caribbean Latin America & Caribbean (excluding high income)Latin America & the Caribbean (IDA & IBRD countries)LatviaLeast developed countries: UN classificationLebanonLesothoLiberiaLibyaLithuaniaLow & middle incomeLow incomeLower middle incomeLuxembourgMacao SAR, ChinaMacedonia, FYRMadagascarMalawiMalaysiaMaldivesMaliMaltaMauritaniaMauritiusMexicoMicronesia, Fed. Sts.Middle East & North AfricaMiddle East & North Africa (excluding high income)Middle East & North Africa (IDA & IBRD countries)Middle incomeMoldovaMongoliaMontenegroMoroccoMozambiqueNamibiaNepalNetherlandsNew CaledoniaNew ZealandNicaraguaNigerNigeriaNorth AmericaNorwayOECD membersOmanOther small statesPacific island small statesPakistanPanamaPapua New GuineaParaguayPeruPhilippinesPolandPortugalPost-demographic dividendPre-demographic dividendPuerto RicoQatarRomaniaRussian FederationRwandaSaudi ArabiaSenegalSerbiaSeychellesSierra LeoneSingaporeSlovak RepublicSloveniaSmall statesSolomon IslandsSomaliaSouth AfricaSouth AsiaSouth Asia (IDA & IBRD)South SudanSpainSri LankaSt. Kitts and NevisSt. LuciaSt. Vincent and the GrenadinesSub-Saharan Africa Sub-Saharan Africa (excluding high income)Sub-Saharan Africa (IDA & IBRD countries)SudanSurinameSwazilandSwedenSwitzerlandSyrian Arab RepublicTajikistanTanzaniaThailandTimor-LesteTogoTongaTrinidad and TobagoTunisiaTurkeyTurkmenistanUgandaUkraineUnited Arab EmiratesUnited KingdomUnited StatesUpper middle incomeUruguayUzbekistanVanuatuVenezuela, RBVietnamWest Bank and GazaWorldYemen, Rep.ZambiaZimbabwe Timeline:
This timeline shows a graph from 1966 to 2016 of Cameroon. No data until 1965. Number of actual observations by date: 51.
Source name:
World Development Indicators
Source organization:
World Bank national accounts data, and OECD National Accounts data files.
Categories, topics:
Economy & Growth
Last updated:
apr 23, 2017
Indicators value changes by year
Minimum:
61.981
jan 1, 1985
Maximum:
78.232
jan 1, 2016
At the date of observation
Value
Absolute change
Change from previous value
jan 1, 1966
74.937
+74.937
0.0%
jan 1, 1967
74.414
-0.523
-0.7%
jan 1, 1968
74.338
-0.076
-0.1%
jan 1, 1969
75.907
+1.57
2.11%
jan 1, 1970
75.218
-0.689
-0.91%
jan 1, 1971
70.459
-4.76
-6.33%
jan 1, 1972
75.308
+4.849
6.88%
jan 1, 1973
75.265
-0.043
-0.06%
jan 1, 1974
71.85
-3.415
-4.54%
jan 1, 1975
69.247
-2.603
-3.62%
jan 1, 1976
71.991
+2.744
3.96%
jan 1, 1977
76.375
+4.385
6.09%
jan 1, 1978
64.436
-11.939
-15.63%
jan 1, 1979
63.448
-0.988
-1.53%
jan 1, 1980
69.407
+5.959
9.39%
jan 1, 1981
68.563
-0.844
-1.22%
jan 1, 1982
70.503
+1.94
2.83%
jan 1, 1983
62.063
-8.44
-11.97%
jan 1, 1984
63.429
+1.366
2.2%
jan 1, 1985
61.981
-1.447
-2.28%
jan 1, 1986
64.247
+2.266
3.66%
jan 1, 1987
62.594
-1.654
-2.57%
jan 1, 1988
67.077
+4.484
7.16%
jan 1, 1989
68.303
+1.226
1.83%
jan 1, 1990
69.195
+0.892
1.31%
jan 1, 1991
66.568
-2.627
-3.8%
jan 1, 1992
64.694
-1.874
-2.82%
jan 1, 1993
70.651
+5.957
9.21%
jan 1, 1994
73.311
+2.66
3.77%
jan 1, 1995
73.831
+0.52
0.71%
jan 1, 1996
72.246
-1.585
-2.15%
jan 1, 1997
71.595
-0.651
-0.9%
jan 1, 1998
72.701
+1.106
1.54%
jan 1, 1999
72.138
-0.563
-0.77%
jan 1, 2000
71.344
-0.794
-1.1%
jan 1, 2001
70.231
-1.113
-1.56%
jan 1, 2002
70.747
+0.516
0.73%
jan 1, 2003
70.772
+0.026
0.04%
jan 1, 2004
72.202
+1.43
2.02%
jan 1, 2005
71.356
-0.845
-1.17%
jan 1, 2006
71.982
+0.625
0.88%
jan 1, 2007
71.533
-0.449
-0.62%
jan 1, 2008
73.223
+1.691
2.36%
jan 1, 2009
75.069
+1.846
2.52%
jan 1, 2010
75.213
+0.144
0.19%
jan 1, 2011
75.013
-0.2
-0.27%
jan 1, 2012
75.876
+0.863
1.15%
jan 1, 2013
76.98
+1.103
1.45%
jan 1, 2014
77.174
+0.194
0.25%
jan 1, 2015
76.869
-0.305
-0.4%
jan 1, 2016
78.232
+1.364
1.77%
Ranking of countries by current statistics by years


Comments: