29
/
en
AIzaSyAYiBZKx7MnpbEhh9jyipgxe19OcubqV5w
April 1, 2024
258415
Syrian Arab Republic
SYR
true
2
1
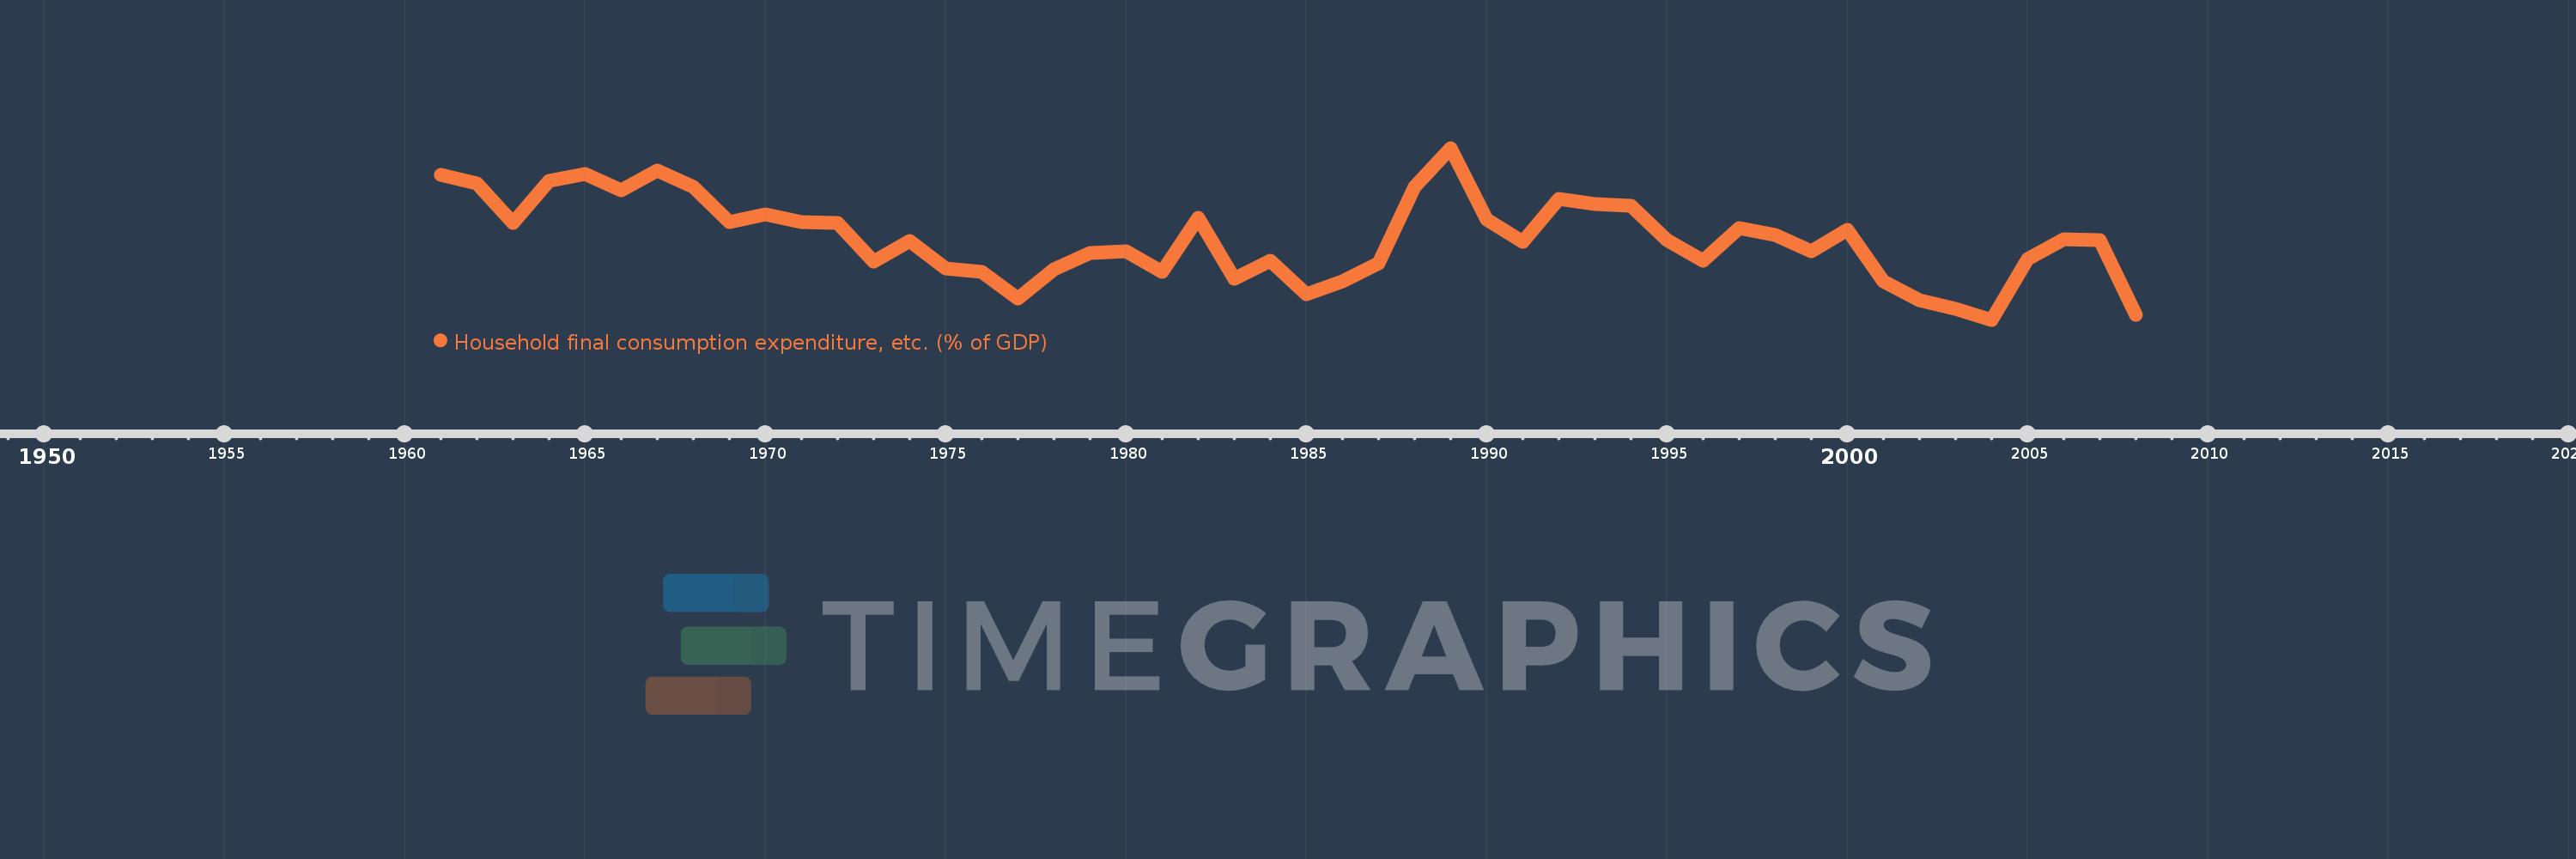
Household final consumption expenditure, etc. (% of GDP)
2008,2007,2006,2005,2004,2003,2002,2001,2000,1999,1998,1997,1996,1995,1994,1993,1992,1991,1990,1989,1988,1987,1986,1985,1984,1983,1982,1981,1980,1979,1978,1977,1976,1975,1974,1973,1972,1971,1970,1969,1968,1967,1966,1965,1964,1963,1962,1961
This statistics in other country:
AfghanistanAlbaniaAlgeriaAngolaAntigua and BarbudaArab WorldArgentinaArmeniaArubaAustraliaAustriaAzerbaijanBahamas, TheBahrainBangladeshBarbadosBelarusBelgiumBelizeBeninBermudaBhutanBoliviaBosnia and HerzegovinaBotswanaBrazilBrunei DarussalamBulgariaBurkina FasoBurundiCabo VerdeCambodiaCameroonCanadaCaribbean small statesCentral African RepublicCentral Europe and the BalticsChadChileChinaColombiaComorosCongo, Dem. Rep.Congo, Rep.Costa RicaCote d'IvoireCroatiaCubaCyprusCzech RepublicDenmarkDjiboutiDominicaDominican RepublicEarly-demographic dividendEast Asia & PacificEast Asia & Pacific (excluding high income)East Asia & Pacific (IDA & IBRD countries)EcuadorEgypt, Arab Rep.El SalvadorEquatorial GuineaEritreaEstoniaEthiopiaEuro areaEurope & Central AsiaEurope & Central Asia (excluding high income)Europe & Central Asia (IDA & IBRD countries)European UnionFaroe IslandsFijiFinlandFragile and conflict affected situationsFranceGabonGambia, TheGeorgiaGermanyGhanaGreeceGrenadaGuatemalaGuineaGuinea-BissauGuyanaHaitiHeavily indebted poor countries (HIPC)High incomeHondurasHong Kong SAR, ChinaHungaryIBRD onlyIcelandIDA & IBRD totalIDA blendIDA onlyIDA totalIndiaIndonesiaIran, Islamic Rep.IraqIrelandIsraelItalyJamaicaJapanJordanKazakhstanKenyaKiribatiKorea, Rep.KosovoKuwaitKyrgyz RepublicLao PDRLate-demographic dividendLatin America & Caribbean Latin America & Caribbean (excluding high income)Latin America & the Caribbean (IDA & IBRD countries)LatviaLeast developed countries: UN classificationLebanonLesothoLiberiaLibyaLithuaniaLow & middle incomeLow incomeLower middle incomeLuxembourgMacao SAR, ChinaMacedonia, FYRMadagascarMalawiMalaysiaMaldivesMaliMaltaMauritaniaMauritiusMexicoMicronesia, Fed. Sts.Middle East & North AfricaMiddle East & North Africa (excluding high income)Middle East & North Africa (IDA & IBRD countries)Middle incomeMoldovaMongoliaMontenegroMoroccoMozambiqueNamibiaNepalNetherlandsNew CaledoniaNew ZealandNicaraguaNigerNigeriaNorth AmericaNorwayOECD membersOmanOther small statesPacific island small statesPakistanPanamaPapua New GuineaParaguayPeruPhilippinesPolandPortugalPost-demographic dividendPre-demographic dividendPuerto RicoQatarRomaniaRussian FederationRwandaSaudi ArabiaSenegalSerbiaSeychellesSierra LeoneSingaporeSlovak RepublicSloveniaSmall statesSolomon IslandsSomaliaSouth AfricaSouth AsiaSouth Asia (IDA & IBRD)South SudanSpainSri LankaSt. Kitts and NevisSt. LuciaSt. Vincent and the GrenadinesSub-Saharan Africa Sub-Saharan Africa (excluding high income)Sub-Saharan Africa (IDA & IBRD countries)SudanSurinameSwazilandSwedenSwitzerlandSyrian Arab RepublicTajikistanTanzaniaThailandTimor-LesteTogoTongaTrinidad and TobagoTunisiaTurkeyTurkmenistanUgandaUkraineUnited Arab EmiratesUnited KingdomUnited StatesUpper middle incomeUruguayUzbekistanVanuatuVenezuela, RBVietnamWest Bank and GazaWorldYemen, Rep.ZambiaZimbabwe Timeline:
This timeline shows a graph from 1961 to 2008 of Syrian Arab Republic. No data until 1960. Number of actual observations by date: 48.
Source name:
World Development Indicators
Source organization:
World Bank national accounts data, and OECD National Accounts data files.
Categories, topics:
Economy & Growth
Last updated:
apr 23, 2017
Indicators value changes by year
Minimum:
58.441
jan 1, 2004
Maximum:
81.179
jan 1, 1989
At the date of observation
Value
Absolute change
Change from previous value
jan 1, 1961
77.615
+77.615
0.0%
jan 1, 1962
76.52
-1.095
-1.41%
jan 1, 1963
71.257
-5.263
-6.88%
jan 1, 1964
76.794
+5.537
7.77%
jan 1, 1965
77.782
+0.987
1.29%
jan 1, 1966
75.571
-2.211
-2.84%
jan 1, 1967
78.18
+2.609
3.45%
jan 1, 1968
76.015
-2.165
-2.77%
jan 1, 1969
71.403
-4.612
-6.07%
jan 1, 1970
72.347
+0.944
1.32%
jan 1, 1971
71.337
-1.01
-1.4%
jan 1, 1972
71.242
-0.095
-0.13%
jan 1, 1973
66.152
-5.09
-7.14%
jan 1, 1974
68.831
+2.679
4.05%
jan 1, 1975
65.176
-3.656
-5.31%
jan 1, 1976
64.793
-0.382
-0.59%
jan 1, 1977
61.257
-3.537
-5.46%
jan 1, 1978
65.153
+3.896
6.36%
jan 1, 1979
67.233
+2.08
3.19%
jan 1, 1980
67.459
+0.226
0.34%
jan 1, 1981
64.791
-2.668
-3.96%
jan 1, 1982
71.957
+7.166
11.06%
jan 1, 1983
63.848
-8.109
-11.27%
jan 1, 1984
66.287
+2.439
3.82%
jan 1, 1985
61.832
-4.456
-6.72%
jan 1, 1986
63.538
+1.706
2.76%
jan 1, 1987
65.858
+2.32
3.65%
jan 1, 1988
76.007
+10.149
15.41%
jan 1, 1989
81.179
+5.171
6.8%
jan 1, 1990
71.753
-9.426
-11.61%
jan 1, 1991
68.718
-3.035
-4.23%
jan 1, 1992
74.425
+5.708
8.31%
jan 1, 1993
73.782
-0.644
-0.86%
jan 1, 1994
73.473
-0.309
-0.42%
jan 1, 1995
68.932
-4.541
-6.18%
jan 1, 1996
66.262
-2.669
-3.87%
jan 1, 1997
70.592
+4.33
6.53%
jan 1, 1998
69.649
-0.943
-1.34%
jan 1, 1999
67.518
-2.131
-3.06%
jan 1, 2000
70.305
+2.787
4.13%
jan 1, 2001
63.507
-6.798
-9.67%
jan 1, 2002
61.015
-2.492
-3.92%
jan 1, 2003
59.873
-1.142
-1.87%
jan 1, 2004
58.441
-1.432
-2.39%
jan 1, 2005
66.48
+8.038
13.75%
jan 1, 2006
69.113
+2.634
3.96%
jan 1, 2007
68.931
-0.182
-0.26%
jan 1, 2008
59.085
-9.846
-14.28%
Ranking of countries by current statistics by years


Comments: